The Documents tab
Below you will find the peculiarities of the Documents tab of the project dashboard of categorization projects.
The characteristics of the tab that are common to all project types are described in the article dedicated to the topic.
Sort the document list
In addition to the sorting options common with other project types, the Categories sorting option available in the list view of the Documents tab, in the context of an experiment, allows you to sort the list of documents based on the number of output categories.
Categories
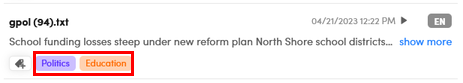
Annotated categories and—when in the context of an experiment—output categories are displayed:
-
In list view: below the document abstract.
-
In detail view: above the document text, that is in the fourth bar from the top of the central panel or in the second bar if immersive view or PDF document view is turned on.
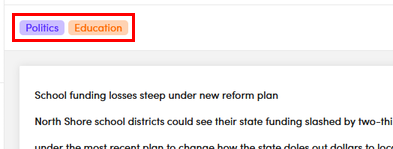
In the default visualization of the detail view, the number of output categories and the number of categories annotated is also shown in the third bar from the top of the central panel, together with annotation buttons.
The Taxonomy tab
In list view
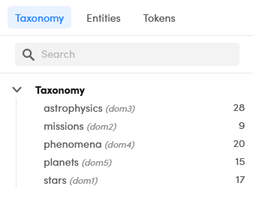
In list view, the Taxonomy tab is displayed in the left panel.
If an experiment is selected, under Categories you'll find the categories that were detected by the experiment model.
Under Annotations are listed the categories that were annotated as expected results.
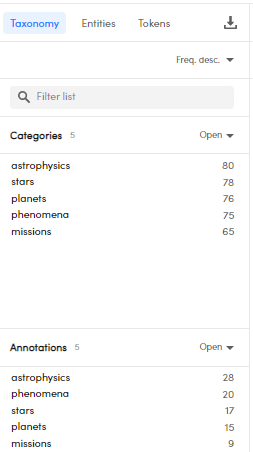
The numbers beside the Categories and Annotations headings are, respectively, the number of distinct categories detected by the experiment model and the number of distinct categories that have been annotated in the current, possibly filtered, set of documents.
The number beside each category under Categories is the number of documents in the current list in which that category was detected by the experiment model. Similarly, the number beside each category under Annotations is the number of documents in which that category was annotated.
Note
Outside the scope of an experiment, if there are no annotations no information is displayed in the tab.
- To filter the lists, type a value or the initial part of it in the Filter list box and press
Enter. The match is case sensitive. Select the X icon inside the box to cancel the filter. - To change the sort order, select the desired option from the dropdown menu at the top right of the list.
- Double-click an item to insert it in the search bar as criteria for document search.
If a list appears truncated, select Open beside its name to give the list maximum space. Select Close to revert to previous visualization.
- To switch to the Resources tab of the project dashboard and show the detail of a category, select or hover over the category and select Show in resources
 .
. - To show more information about a category, select or hover over it and select Show info
 .
.
In detail view
In detail view, the Taxonomy tab on the right shows the project taxonomy.
The number to the right of the category is the number of documents in which the category has been annotated as the expected result.
Within the tab you can:
- Expand and collapse the nodes.
- Search for categories in the taxonomy.
- Filter documents by category.
- Filter documents by annotation.
-
Switch to the Resources tab of the project dashboard and show the detail of a category:
- Select or hover over the category under Taxonomy in the Taxonomy tab of the left panel.
- Select Show resources .
The right panel in list view
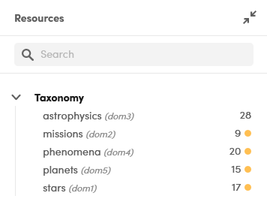
In the list view the Resources panel on the right shows the project taxonomy.
Select Expand  and Collapse
  to expand and collapse the panel.
The number to the right of the category is the number of documents in which the category has been annotated as the expected result.
The colored dot beside the number is:
 red if there are less than six documents in which the category has been annotated.
 yellow if there are between six and 20 documents in which the category has been annotated.
There is no colored dot if there are more than 20 documents in which the category has been annotated.
The actions you can perform within the panel are the same available in the Taxonomy tab of the detail view (see above).
Manage annotations
In categorization projects, both the list view and detail view of the Documents tab have numerous controls for annotating categories and sections.
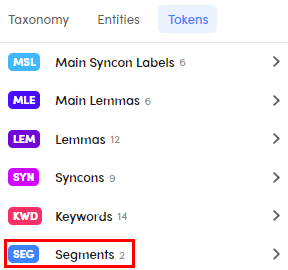
Segments
Segments are block of text identified by specific rules in Studio projects.
Segments are part of the output of experiments based on CPK models imported from Studio. When detected, they are listed under the Tokens tab, which is inside the left panel in list view and inside the right panel in detail view.
Sections
In the detail view and its variants you can toggle the display of sections. To do this, use the Toggle sections  toggle switch on the toolbar next to the document name. The button is enabled only if sections have been defined.
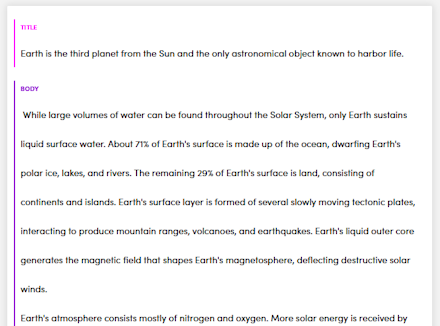
In the absence of explicit annotations, all text belongs to the standard section.
In the dedicated article you will find information on how to annotate sections.
Create a new category
When in detail view, to create a new category using a portion of the text of the document as the category name (which you can later change):
- Select the portion of text corresponding to the category name. A pop-up menu will appear.
- Select Create category. The New category dialog will appear.
- To create broader or narrower categories do as described in the article about editing the taxonomy.
The project taxonomy will be accordingly updated.
Open a document in Studio
It is possible to copy a document and its annotations to Studio and have it automatically be prepared and analyzed there.
Requirements:
- Studio version 4.0.0 or later.
- The Platform project must have been previously linked to the Studio project.
To trigger the action, when in detail view, select Open document in Studio  .
.
If Studio is not running, it will start automatically and open the latest project you worked on. If not connected to the Platform, but with a profile for that instance, it will automatically connect to it.
Debug information
If the current experiment returned results for the document, in detail view, it's possible to have debug information that helps explaining each result.
To see debug information about the output categories, select Toggle debug extractions  . The Debug panel will appear on the right.
Note
The model type is chosen when running the experiment.
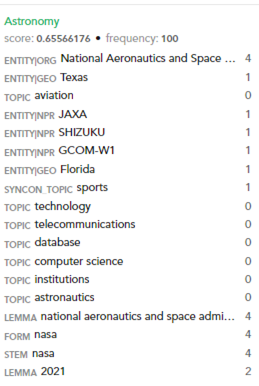
For these model types:
- Studio
- Bootstrapped Studio Project
- Explainable Categorization
The following information is displayed:
-
Category name
Note
The color of the category name is green for true positives or orange for false positives.
-
Score
- Frequency
- Rules that were triggered causing the output of the category

For these ML model families:
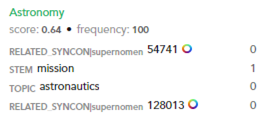
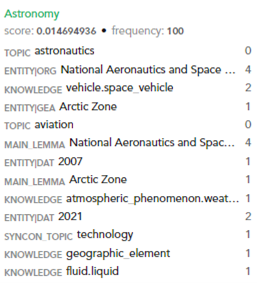
Note
A single model type for each family has been considered as an example picture. The amount of available text features varies based on the selected model type.
The following information is displayed:
-
Category name
Note
The color of the category name is green for true positives or orange for false positives.
-
Score
- Frequency
- Occurrences of the text features that determined the prediction
To highlight the hits of a rule or the text features that determined the prediction, select them from the list. For each rule hit, the rule scope (for example, the sentence) is highlighted. For each text feature, the specific word is highlighted. Each highlight is marked with the EXP label that stands for explanation.
The selection of multiple rules or multiple text features with Ctrl+Click is possible.
Note
The number of occurrences is reported. When the occurrence number is zero, nothing is highlighted in the text, because the feature refers to the document as a whole.
When highlighting, a highlight counter  is displayed beside the panel name. Select the X
  to remove all highlights.