Libraries statistics
Overview
The Documents analytics sub-tab  of the Documents tab offers an at-a-glance view of the statistics related to the thesaurus libraries.
It is made of several panels and sub-panels:
- Resources
- Coverage
- Disambiguator
- Languages
- Main topics
- Documents
Note
- Select the expanding
 and collapsing
  arrows to expand and collapse the available sub-panels.
 - To switch from the Coverage panel to the Main topics one and vice versa, use the left
 and right arrow
  beside the panel name.
Resources
Top & worst concepts
The Top & worst concepts sub-panel shows the quantity of documents with extractions and/or annotations of your project concepts.
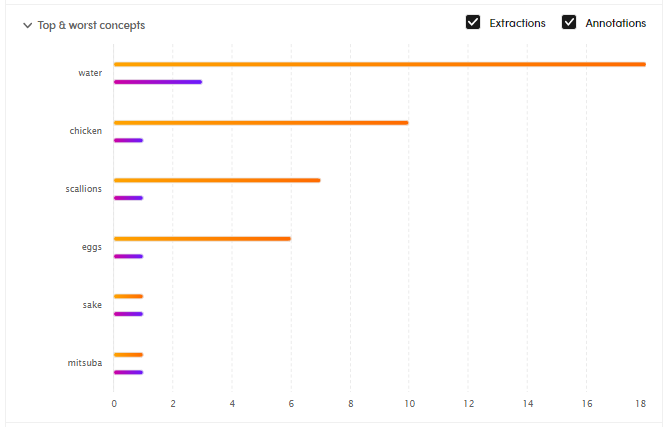
- Check or uncheck the Extractions or the Annotations boxes to filter your analysis.
- Hover over the orange line to know the number of documents with the extractions of a concept.
- Hover over the violet line to know the number of documents with the annotations of a concept.
- Double-click the orange line and/or the violet line to perform a search based on extractions and annotations.
Annotations vs Extractions
The Annotations vs Extractions sub-panel is a bubble diagram: the y-axis represents the number of documents with annotations, the x-axis represents the number of documents with extractions.
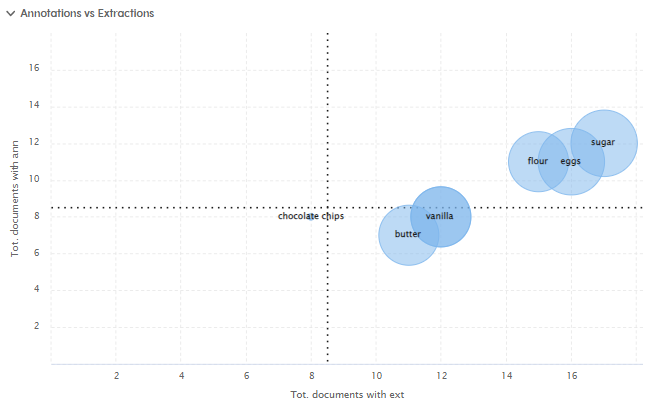
Each bubble represents a concept. Hover over it to find out how many documents have that concept annotated and extracted. The bigger the bubble, the bigger the difference between the number of documents with extractions and annotations of that concept and vice versa.
The width of the bubbles helps you understand on which concept you have to work more.
Note
Double-click the bubbles to perform searches.
Relevant documents
The Relevant documents sub-panel lists all documents with—and without—extractions and annotations:
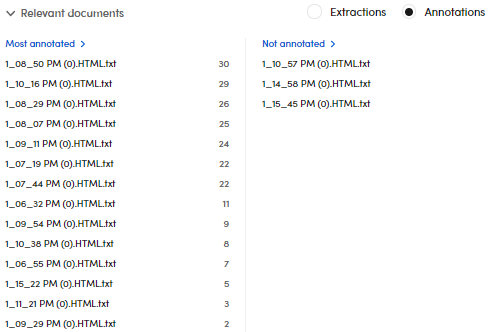
- Check the Annotations or Extractions boxes to view documents based on your needs.
- Select a document to open it in detail view.
- Select Most annotated, Not annotated, (when the Annotations box is checked) Most extracted, Not extracted to apply filters.
Coverage
The Coverage panel summarizes:
- The total number of concepts.
- The number of extracted and annotated concepts with their percentages.
- The number of documents with extractions with percentage.
- The number of documents with annotations with percentage.
- The number of documents with validation with percentage.
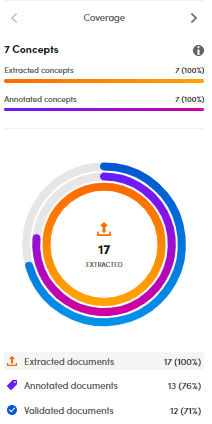
Double-click Extracted documents, Annotated documents, Validated documents or one of their corresponding lines on the chart to apply filters.
Other panels
For the Disambiguator panel, made of the following sub-panels:
- Most relevant terms
- Main entities
- Main syncon labels
and the other ones—Documents, Main topics and Languages—their content is the same described in the corpora analytics.
Note
- Use the sub-panels above and the Main topics panel to perform searches.
- Use the Documents panel to filter your documents.