Experiments quality
To view the quality of an experiment:
- Go to the experiments dashboard.
- Select the experiment from the Experiments panel.
Or:
- Select the last experiment Statistics from the Experiments dropdown menu.
- Select the experiment from the Experiments panel.
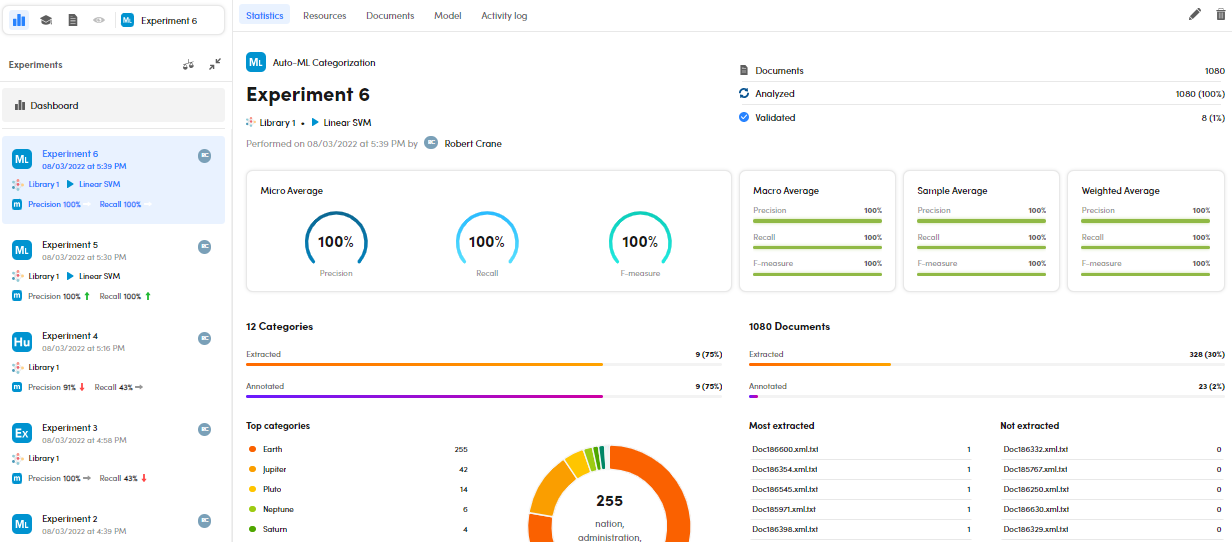
The Statistics sub-tab—displayed by default—shows a set of statistical information about an experiment.
Information about the experiment
In the upper side tab, you can see the experiment details, such as:
- Experiment name
- Performance date and time
- Experiment author
- Engine type
- Number of library documents
- Number of analyzed documents
- Number of validated documents
- Training library
- ML Model type in case of ML Engine
Check the quality
To visually check the experiment quality measurements, such as: Precision, Recall, and F-measure, watch the charts in the middle side tab.
The quality measurements are displayed in the following metrics:
- Micro Average
- Macro Average
- Sample average
- Weighted Average
The metric in focus is selected in the Settings window, Experiments tab. The specific metric icon is also displayed in the experiment card.
Resources analytics
Select the Resources sub-tab to get category analytics for the current experiment.
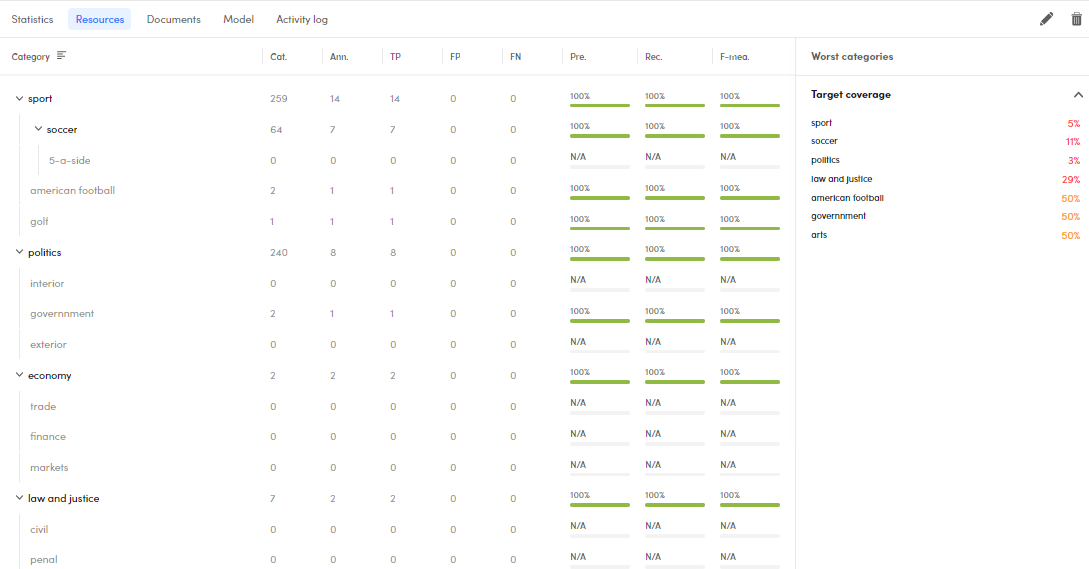
If there were annotations so that metrics could be calculated, this data is shown for each category:
- Cat: number of hits
- Ann.: number of annotations
- TP: true positives
- FP: false positives
- FN: false negatives
- Pre.: precision
- Rec.: recall
- F-mea.: F-Measure
If metrics couldn't be computed, only the number of hits is displayed.
Sort the resources
By default, categories are displayed in their hierarchical tree structure. This is indicated by the bars icon  to the right of the Category label above the list.
To expand or collapse a branch of the tree, select the arrow icon to the left of the category name.
to the right of the Category label above the list.
To expand or collapse a branch of the tree, select the arrow icon to the left of the category name.
To sort the list on the values of a column and change the sort order, select the up and down arrow icons next to the column header. Selecting the bars icon next to the Category label or sorting on the values of another column switches to a flat list view. In this view, the up or down arrow button also appears next to the Category column header and it is possible to sort the categories also on the values of that column.
To restore the tree view, repeatedly select the arrow icon to the right of the Category label until it the bars icon appears again.
Filter categories
To filter the list of categories by their name, type something in the search box at the top right and press Enter: only categories whose name contains what you typed will be displayed.
To cancel the filter select the X icon  in the search box.
Search documents
To find the library documents for which a category was predicted, hover over the category and select Search  .
.
You will be brought to the Documents statistics tab already filtered on the selected category.
Show a class in Resources
To see a category inside the category tree in the main Resources tab, hover over the category and select Show in resources  .
.
Show info
To show additional information about a category, such as its broader category and the annotations, hover over the category and select Information about this category  .
.
Worst categories
The Worst categories panel on the right lists several information boxes about the worst project categories:
| Infobox name | Description |
|---|---|
| Precision | Top 10 categories with a precision lower than 70% |
| Recall | Top 10 categories with a recall lower than 70% |
| Target coverage | Top 10 categories with a coverage of the library documents lower than 70% |
| False positive | Top 10 categories with a percentage of false positives lower than 30% |
The target coverage is calculated as follows:
(True Positives + False Positives)/Number of documents
The percentage of false positives is calculated as follows:
False Positives/Number of documents
Export resources' metrics
To export resources' metrics to a CSV file select Download  from the toolbar at the top right.
A dialog with two tabs appears. In the default tab, Export, set the name of the file to export and select Export to start producing the file. In the Download tab you can observe the progress of the operation and, once the file is ready, download it. When the file is ready a pop-up will also appear shortly in the bottom right corner of the page.
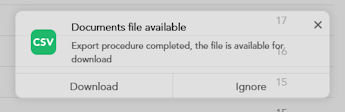
To download the file, select Download inside the pop-up or in the Download tab, next to the file name. The file is downloaded to your browser's download folder.
Inside the CSV file, the field delimiter is the comma (,) and the text qualifier is the quotation mark (").
If you don't need it, you can delete a completed export to free up space by selecting Remove next to the file name.
To leave the dialog select Cancel, when available, or click anywhere outside the dialog.
Check documents' metrics
To check the quality of document-level categorization, select the Documents sub-tab and then the Documents with metrics tab within it.
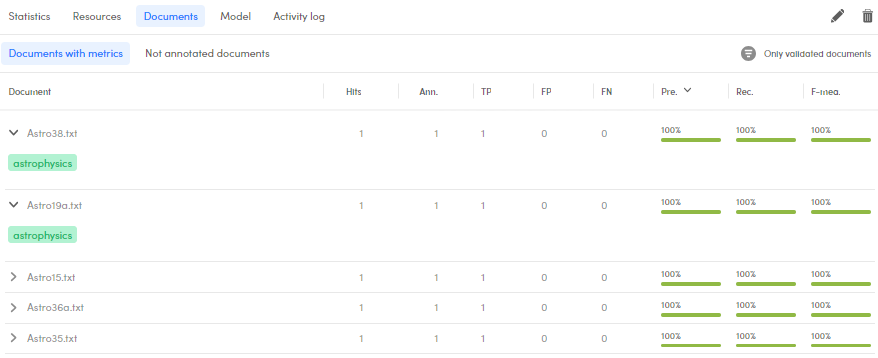
For each document, the following information is displayed:
- Document validated icon
 if the document was validated
 - Hits: number of output categories
- Ann.: number of annotations
- TP: true positives
- FP: false positives
- FN: false negatives
- Pre.: precision
- Rec.: recall
- F-mea.: F-measure
Sort the documents
To sort the list of documents based on the values of a column, select the column header. Do it again to reverse the sort order.
Export documents' metrics
To export documents' metrics to a CSV file select Download from the toolbar at the top right.
A dialog with two tabs appears. In the default tab, Export, set the name of the file to export and select Export to start producing the file. In the Download tab you can observe the progress of the operation and, once the file is ready, download it. When the file is ready a pop-up will also appear shortly in the bottom right corner of the page.
To download the file, select Download inside the pop-up or in the Download tab, next to the file name. The file is downloaded to your browser's download folder.
Inside the CSV file, the field delimiter is the comma (,) and the text qualifier is the quotation mark (").
If you don't need it, you can delete a completed export to free up space by selecting Remove next to the file name.
To leave the dialog select Cancel, when available, or click anywhere outside the dialog.
Show results
To show the results of the experiment for a document, select the expand icon  to the left of the document name. Under the document name you will see a colored chip for every true positive, false positive and false negative.
Open a document and add annotations
To open a document in detail view based on a selected experiment in focus, hover over it and select Open document  . The document will open in the detail view.
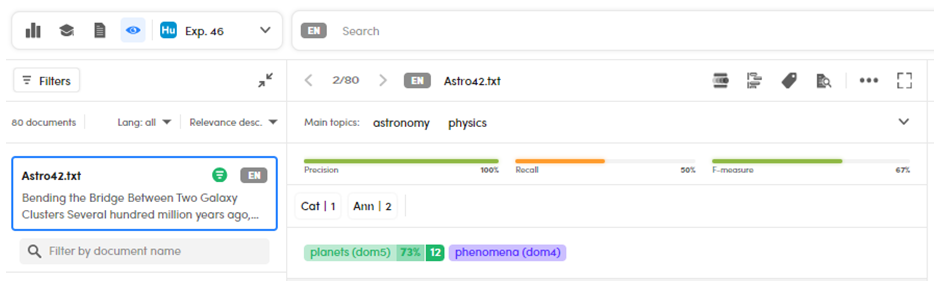
In the selected experiment, Ex 46, the categories Vegan recipes and Vegetarian recipes are recognized as false negatives in the selected document.
What you see is a record of the document before the latest experiment was performed in comparison with the selected one.
In this view, annotation is not possible. To annotate, select Annotate documents  from the toolbar beside the document name. This is what you will see:
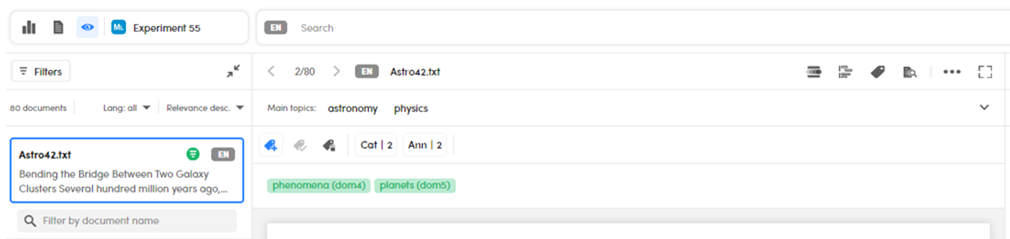
As you can see from the latest experiment now in focus—Experiment 55—Vegan recipes is a true positive. This means that after Ex 46 and before Experiment 55 the category Vegan recipes has been turned into a true positive.
An alternative to see this view while in the experiment dashboard with an experiment in focus is:
- In the Documents with metrics sub-panel, hover over a document.
- Select Annotate document .
Filter validated documents
To filter validated documents, select Only validated documents to get the filter criteria:
 = no filtering.
 = only validated documents.
 = only not validated documents.
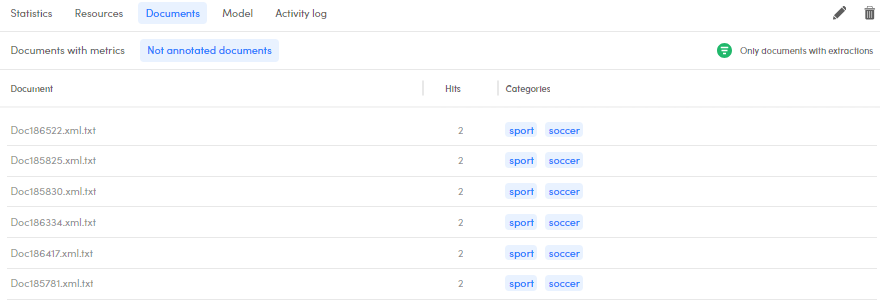
Not annotated documents
Select the Not annotated documents sub-panel. The list shows the non-annotated documents that get resulting categories from the experiments and they are displayed with a blue chip  .
.
To annotate a document
To annotate a document, hover over the document of interest and select Annotate document , then, follow the annotation procedure.
Open a document in detail view
To open a document in the detail view, hover over the document of interest and select Open document .
When there, select Annotate documents to start annotating.
Filter documents with extractions
To filter documents with extractions, select Only documents with extractions to get the filter criteria:
- = no filtering.
- = only documents with extraction.
- = only documents with no extraction.
Show resources
To show resources, select Show resources.
Delete the experiment
To delete the experiment, select Delete  .
.
Show the experiment analytics
To show the analytics of an experiment:
- Select an experiment in the Experiments panel.
- Select Documents analytics
 .
.
The data you will see are the same reported in the dedicated page. While there, you can also select:
- Browse documents
 to see the document statistics.
 - Show resources to see the experiment resources.
Edit the experiment name
To edit the experiment name, select Edit experiment name  .
.
Select other experiments
To view a different experiment, select it from the Experiments panel.
View the model generated by the experiment in focus
Select the Model sub-tab.
Activity log
Select the Activity log sub-tab to check the logs.