Experiments dashboard
To display the experiments dashboard, select:
- Dashboard in the Experiments dropdown menu.
Or:
- Dashboard in the Experiments panel if you are in the Statistics tab of an experiment.
Note
To display the Dashboard panel, it is necessary to have more than two experiments. If you have two experiments in list, it will be possible to display just the Experiments comparison.
The Dashboard panel shows a series of analytics useful to understand the overall experiments quality and trend and its visual form depends on the performed experiments number.
The panel displays the models used, the experiments names, date, time and author.
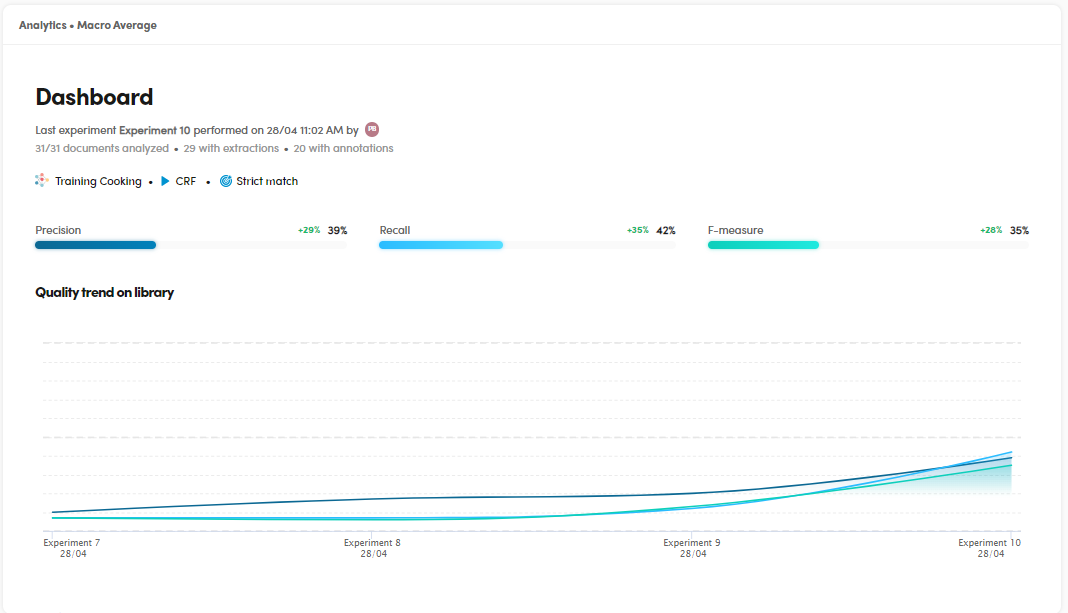
Last experiment quality
On top of the panel you can see the last experiment performance date and time, the author, the analyzed documents, the documents with extractions and with annotations, the library used, the match strategy, Precision, Recall and F-measure metrics.
Overall quality trend on library
To check the quality trend on library, watch the chart under the Quality trend on library area showing Precision, Recall and F-Measure of the overall experiments.
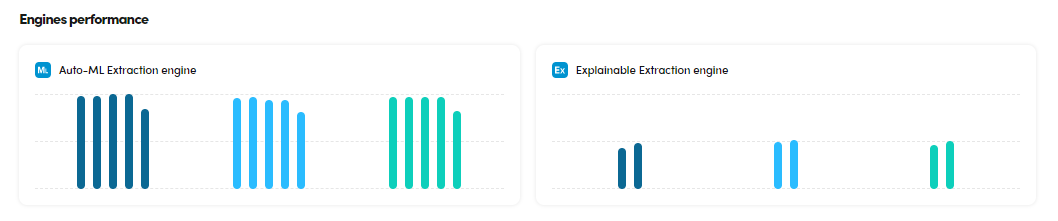
Engines performance
To check the different models performance, in the dashboard upper part:
- Watch the charts under Engines performance.
- Hover over the bars of the charts to find out the metrics details of the single experiments.
Experiment list
The experiment list displays a summary of the experiments features and their main quality indicators. Ext. stands for the number of extractions, while Ann. stands for the number of annotations.
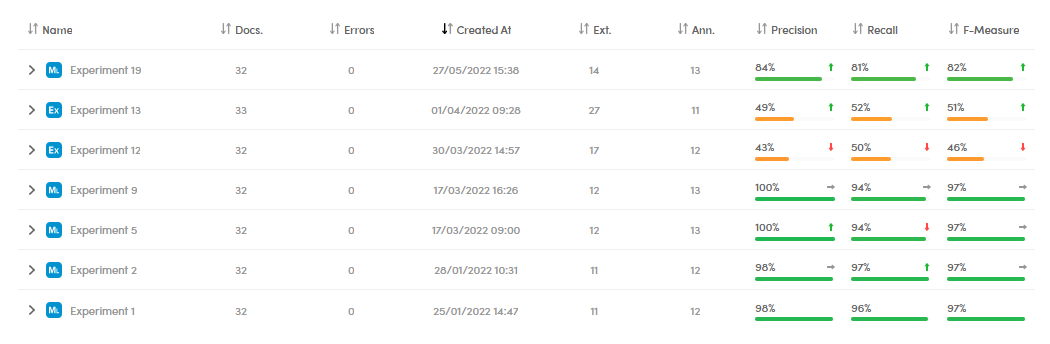
To sort the experiment list, ascending or descending, based on an item, select the arrows beside a column header.
Note
Select the expanding arrow  for information about the training library and the Train settings.
Library coverage
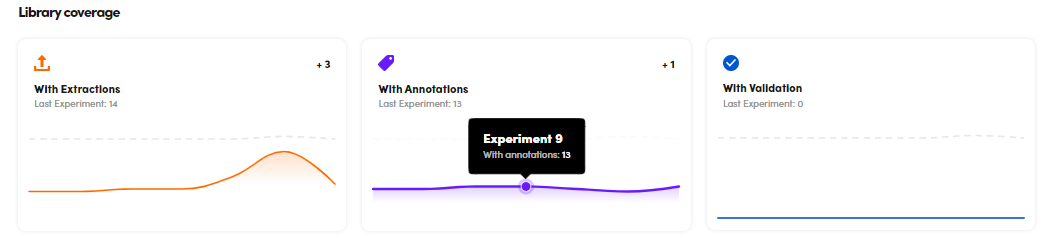
To check the library coverage, watch the charts in the Library coverage area showing the quality in graphic form in terms of documents:
- With Extractions.
- With Annotations.
- With Validation.
Hover over the charts to watch the details.
Note
Based on the number of experiments, this chart can have different visual formats.
Compare experiments
To compare experiments, see Experiments comparison.
Show a specific experiment
To display a specific experiment, select it in the Experiments left panel.