Experiments quality
Overview
To view the quality of an experiment:
- Go to the experiments dashboard.
- Select the experiment from the Experiments panel.
Or:
- Select Statistics from the Experiments dropdown menu,
- Select the experiment from the Experiments panel.
Note
In the Experiments panel, select Expand  and Collapse
  to expand and collapse the panel.
The Statistics sub-tab—displayed by default—shows a set of statistical information about an experiment.
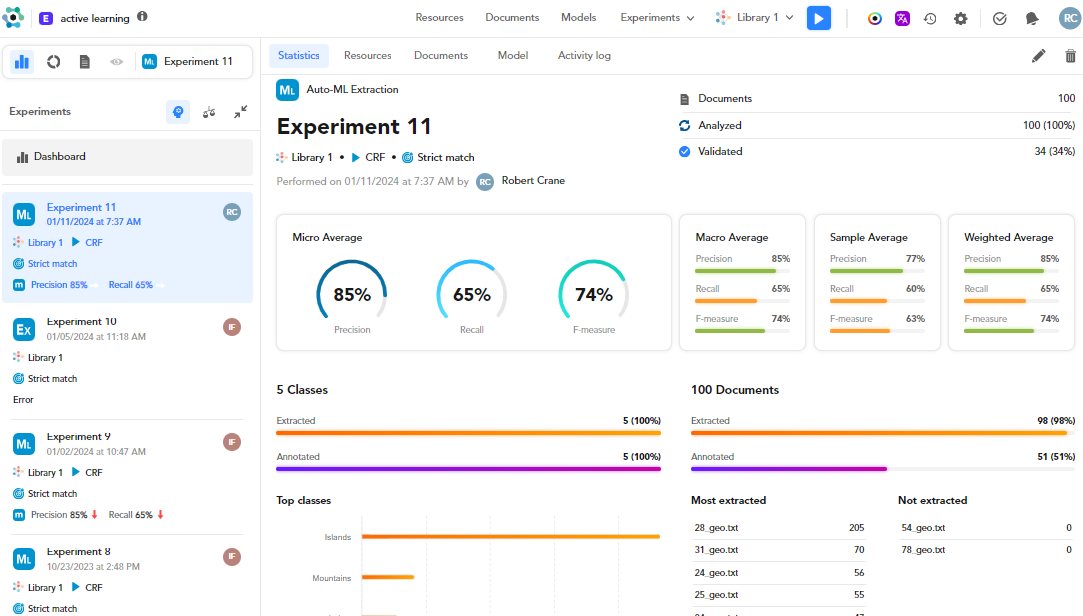
Information about the experiment
In the upper side tab you can see the experiment details, such as the:
- Experiment name
- Model type
- Performance date and time
- Experiment author
- Number of library documents
- Analyzed documents
- Validated documents
- Training library
- ML Model type in case of the Auto-ML Extraction as selected model.
- Matching strategy
Read the quality
The quality measurements are displayed in the following metrics:
- Micro Average
- Macro Average
- Sample Average
- Weighted Average
The metric in focus is selected in the Settings window, Experiments tab. The specific metric icon is also displayed in the experiment card.
Check annotated and extracted documents and classes
In the lower part, is is reported the number of:
- Classes and documents
- Number of extracted and annotated classes and documents
Check the Top classes chart to see the most extracted classes. Hover over the orange line to know the count of extraction of a specific class.
Check the Most extracted and Not extracted documents to see documents with most extractions and documents with no extractions.
Hover over a document and select Open document  to open a document in detail view.
Hover over a document and select Annotate document  to annotate it.
Note
More details about Annotate document and Open document below.
Resources analytics
Select the Resources sub-tab to get class analytics for the current experiment.
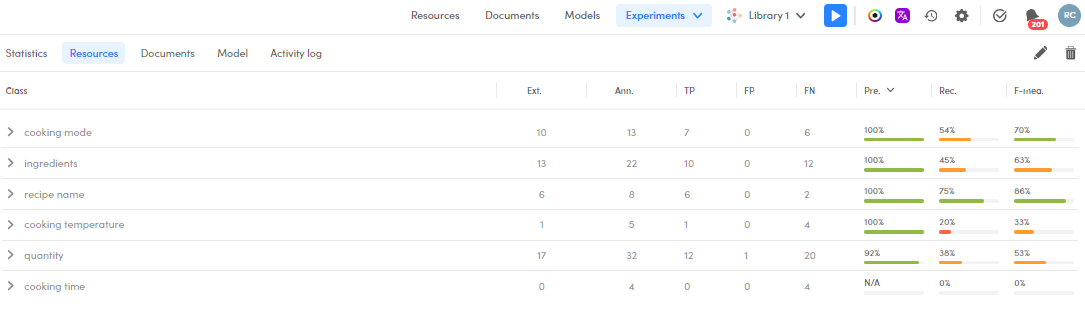
If there were annotations so that metrics could be calculated, this data is shown for each class:
- Ext.: number of extractions
- Ann.: number of annotations
- TP: true positives
- FP: false positives
- FN: false negatives
- Pre.: precision
- Rec.: recall
- F-mea.: F-Measure
If metrics couldn't be computed, only the number of hits and the document coverage are displayed.
Sort the resources
You can sort the list of classes on the values of a column by selecting the column header and by doing the same again you can reverse the order.
Filter classes
To filter the list of classes by their name, type something in the search box at the top right and press Enter: only classes whose name contains what you typed will be displayed.
To cancel the filter select the X icon  in the search box.
You can filter groups too.
To manage the group filter select the gear icon  at the right end of the search box. A pop-up panel appears.
- Select the groups you are interested in: only selected groups will be listed in the Resources panel.
- To filter the list of groups in the pop-up panel, type some text in the search box and press
Enter: only groups with names containing the text you typed will be listed. The match is case insensitive. Select the X icon inside the search box to cancel the filter. - Use the checkbox at the top of the pop-up panel to either select or deselect all groups.
- Ungrouped class is the virtual group of all the classes not belonging to a group.
- To hide the group filter just click outside the pop-up.
Check the top and worst extractions of a class
If there are metrics, to check the top and worst extractions of a specific class, select the related expanding icon  .
.
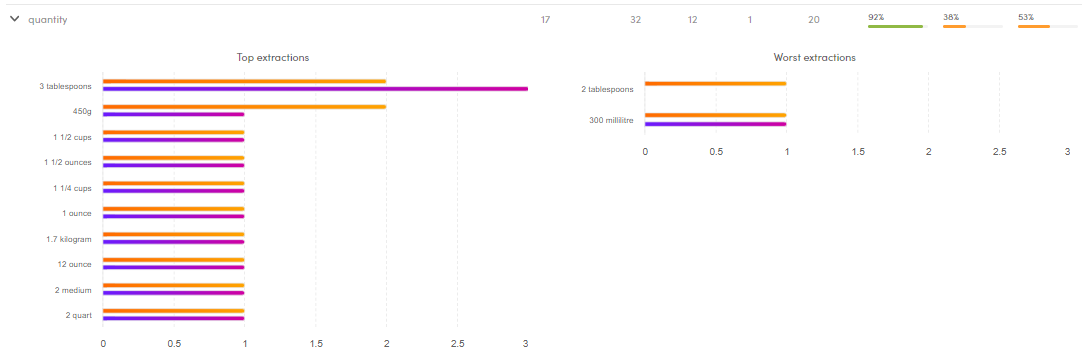
The orange line represents the number of documents with extractions of a value, while the violet one the number of documents with annotations of a value.
Search documents
If there are metrics, to find the library documents for which a class was predicted, hover over the class and select Search  .
.
You will be brought to the Documents statistics tab already filtered on the selected class.
Show a class in Resources
If there are metrics, to see a class in the main Resources tab, hover over the class and select Show in resources  .
.
Export resources' metrics
To export resources' metrics to a CSV file select Download  from the toolbar at the top right.
A dialog with two tabs appears. In the default tab, Export, set the name of the file to export and select Export to start producing the file. In the Download tab you can observe the progress of the operation and, once the file is ready, download it. When the file is ready a pop-up will also appear shortly in the bottom right corner of the page.

To download the file, select Download inside the pop-up or in the Download tab, next to the file name. The file is downloaded to your browser's download folder.
Inside the CSV file, the field delimiter is the comma (,) and the text qualifier is the quotation mark (").
If you don't need it, you can delete a completed export to free up space by selecting Remove next to the file name.
To leave the dialog select Cancel, when available, or click anywhere outside the dialog.
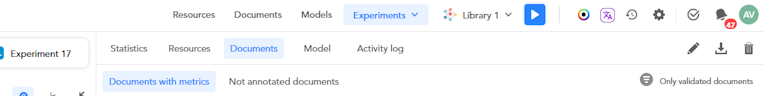
Check documents' metrics
To check the quality of document-level extractions, select the Documents sub-tab and then the Documents with metrics tab within it.
For each document, the following information is displayed:
- Document validated icon
 if the document was validated
 - Ext.: number of extractions
- Ann.: number of annotations
- TP: true positives
- FP: false positives
- FN: false negatives
- Pre.: precision
- Rec.: recall
- F-mea.: F-measure
Sort the documents
To sort the list of documents based on the values of a column, select the column header. Do it again to reverse the sort order.
Export documents' metrics
To export documents' metrics to a CSV file select Download from the toolbar at the top right.
A dialog with two tabs appears. In the default tab, Export, set the name of the file to export and select Export to start producing the file. In the Download tab you can observe the progress of the operation and, once the file is ready, download it. When the file is ready a pop-up will also appear shortly in the bottom right corner of the page.
To download the file, select Download inside the pop-up or in the Download tab, next to the file name. The file is downloaded to your browser's download folder.
Inside the CSV file, the field delimiter is the comma (,) and the text qualifier is the quotation mark (").
If you don't need it, you can delete a completed export to free up space by selecting Remove next to the file name.
To leave the dialog select Cancel, when available, or click anywhere outside the dialog.
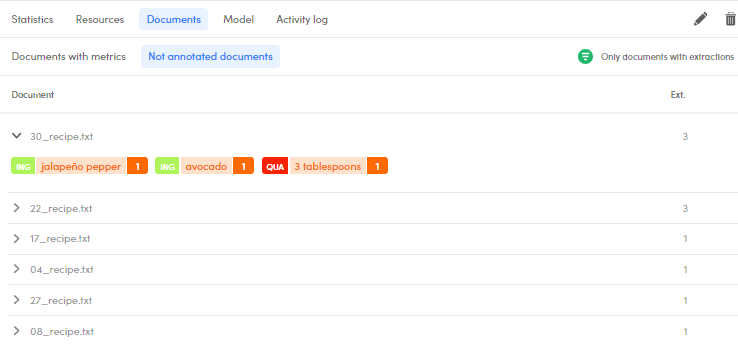
Show results summary
To show a summary of the experiment results for a document, select the expand icon to the left of the document name.
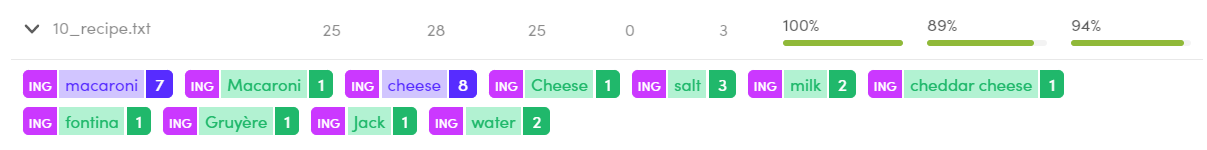
You will see one chip for every value that was either extracted or annotated.
The left part of the chip is the class code, the central part is the value and the right part is the sum of the number of extractions and unmatched annotations.
The color of the left part if the color of the class, the color of the other part reflects the worst outcome for the value:
- Violet means that there is at least one false negative, but if the number is greater than one there can also be false positives and/or true positives.
- Orange means that there are no false negatives and there is at least one false positive, but if the number is greater than one there can be true positives.
- Green means that all occurrences are true positives.
In the image above olive oil has number two, so there is at least one unmatched annotation (false negative), but there can also be one false negative or true positive. chicken doesn't have unmatched annotations (false negatives), has at least one false positive and there can be from zero to seven true positives.
Open a document and add annotations
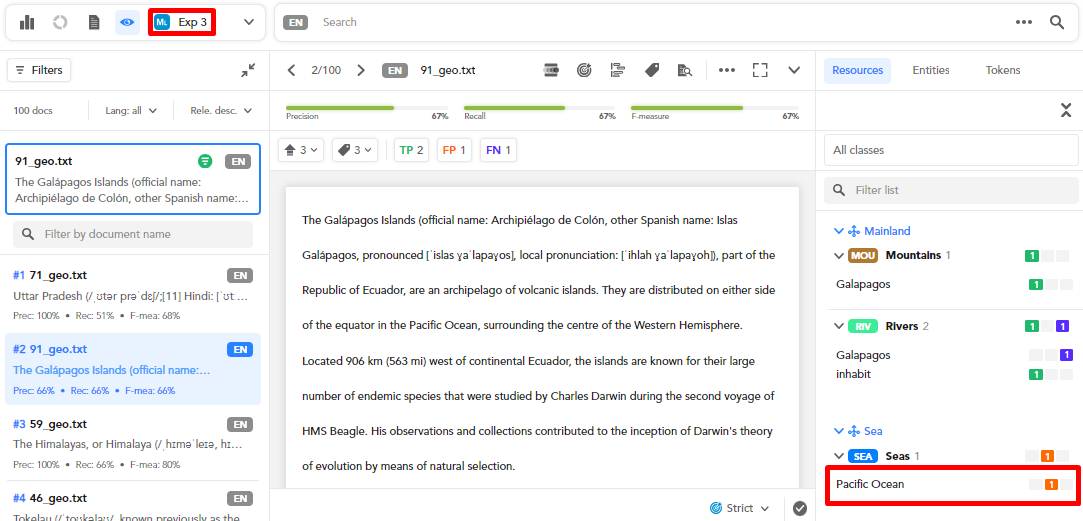
To open a document in detail view based on a selected experiment in focus, hover over it and select Open document . The document will open in the detail view.
For example:
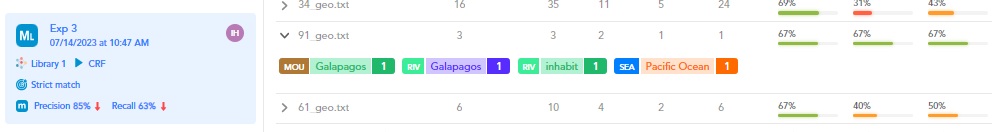
In the selected experiment, Exp 3, the value Pacific Ocean has a single false positive occurrence in the document 91_geo.txt.
Evidence of this is available when Open document is selected.
What you see is a record of the document before the latest experiment was performed in comparison with the selected one.
In this view, annotation is not possible. To annotate, select Annotate documents from the toolbar beside the document name. This is what you will see:
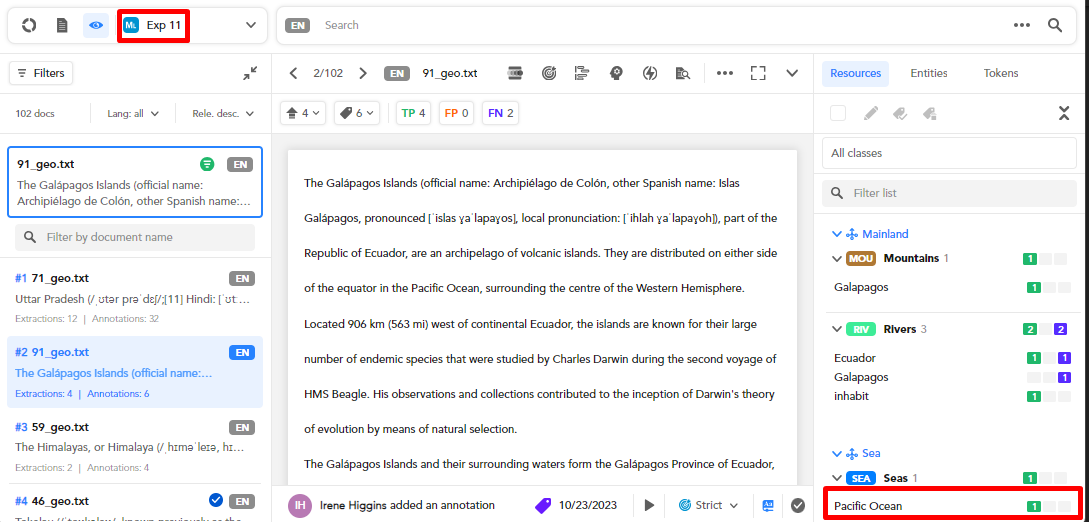
As you can see, the latest experiment—Exp 11— is in focus and the value Pacific Ocean is now a true positive. This means that after Exp 3 and before Exp 11 the value Pacific Ocean has been turned into a true positive.
An alternative to see this view while in the experiment dashboard with an experiment in focus is:
- In the Documents with metrics sub-panel, hover over a document.
- Select Annotate document .
Filter validated documents
To filter validated documents, select Only validated documents to get the filter criteria:
 = no filtering.
 = only validated documents.
 = only not validated documents.
Check the not annotated documents
To check the non-annotated documents, select the Not annotated documents sub-panel.
For each document, the extraction count is displayed.
View and hide the annotated items
To view the annotated items for a document, select the expanding icon .
Sort the documents
To sort the documents based on an item, hover over a column header and select the arrow beside it.
Add annotations
To add annotations to a document:
- Hover over the document of interest and select Annotate document .
- Follow the usual annotation procedure.
Open a document in detail view and then annotate
To open a document in detail view, hover over the document of interest and select Open document .
While in there, select Annotate documents to start annotating the document in the detail view of the Documents tab.
Filter documents with extractions or without extractions
Click the icon beside Only documents with extractions until it turns into one of the following forms:
- = no filter.
- = only documents with extractions.
- = only documents with no extractions.
Edit the experiment name
To edit the experiment name, hover over the experiment name and select Edit experiment name  .
.
Delete the experiment
To delete the experiment, select Delete  .
.
Show the experiment analytics
To show the analytics of an experiment:
- Select an experiment in the Experiments panel.
- Select Documents analytics
 .
.
The data you will see are the same reported in the dedicated page. While there, you can also select Browse documents  to see the document statistics.