Overview
In the Overview tab of the administration dashboard you can find an infographic showing the status of the Platform at a glance.
-
The Authoring section is about the authoring application and shows:
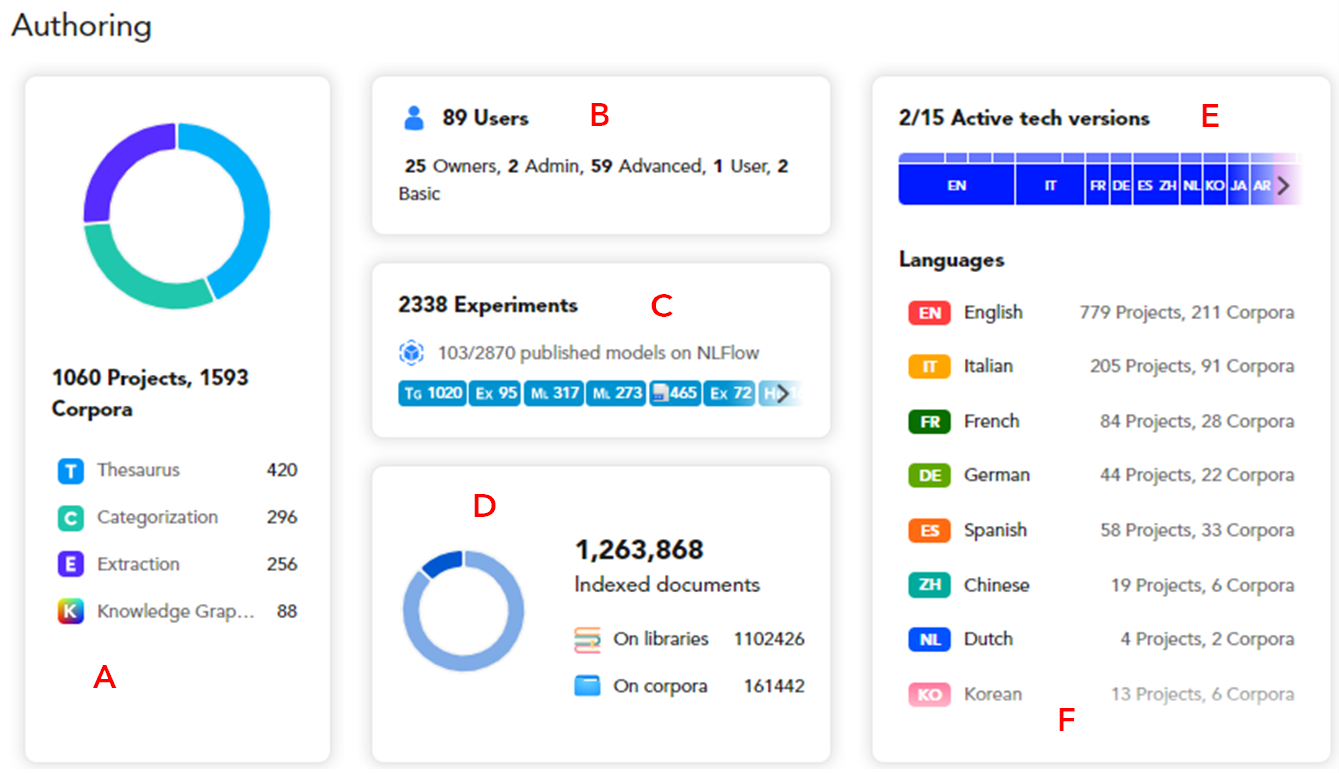
- (A) The number of projects by type.
- (B) The number of users by role.
-
(C) The number of experiments.
Info
Hover over the blue chips in the Experiments area to display a tooltip showing the experiment type.
-
(D) The total number of documents inside libraries or corpora.
-
(E) Active tech version.
Info
Hover over the tech version in the Active tech versions area to display a tooltip with the long description of the tech version.
-
(F) The languages used in the projects.
-
The NL Flow section is about the NL Flow application and shows:
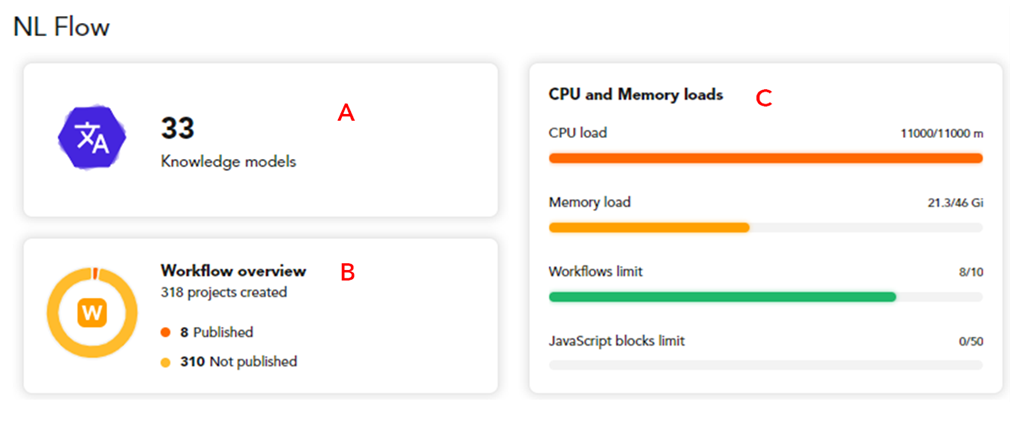
- (A) The number of Knowledge models listed in the inventory.
- (B) The number of workflows, published and not.
- (C) CPU and memory loads.