Experiments quality
Overview
To view the quality of an experiment:
- Go to the experiments dashboard.
Or:
- From the Experiments dropdown menu, select last experiment Statistics.
- From the Experiments panel, select the experiment you want.
Note
Select Expand  or Collapse
  to expand and collapse the Experiments panel.
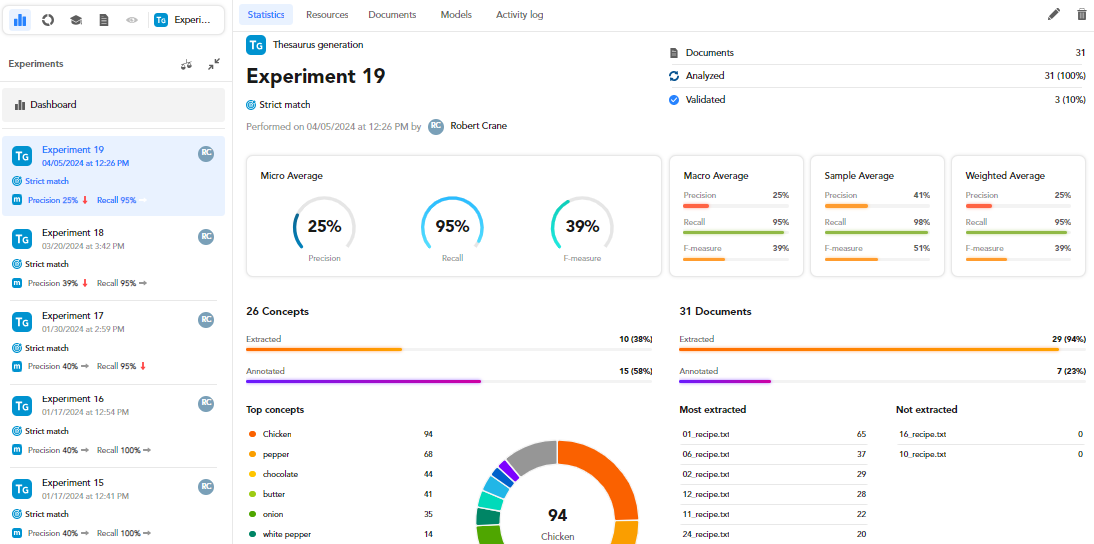
The Statistics sub-panel—displayed by default—shows a set of statistical information about a selected experiment.
Information about the experiment
On the upper side, you can see the experiment details, such as:
- Engine type
- Experiment name
- Matching strategy
- Experiment author
- Experiment performance date and time
- Number of documents in the library
- Number of analyzed documents
- Number of validated documents
Edit experiment name
To edit the experiment name, select Edit experiment name  in the upper right corner.
Delete the experiment
To delete the experiment, select Delete  in the upper right corner.
Read the quality measurements
To visually read the experiment quality measurements, such as: Precision, Recall, and F-measure, check the charts in the middle side tab.
The quality measurements are displayed in:
- Micro Average
- Macro Average
- Sample average
- Weighted Average
The metric in focus is selected in the Settings window, Experiments tab. The specific metric icon is also displayed in the experiment card.
Extracted and annotated concepts and documents
In the lower side there are two areas:
- Concepts
- Documents
The Concepts area reports the:
- Number of project concepts with corresponding percentage.
- Number of extracted and annotated concepts with corresponding percentage.
- Top concepts listing the concepts with the highest number of hits in your documents.
Hover over each concept and:
- To open the search bar, hover over the concept and select Search
 . You will see the Documents statistics tab with the filtered list of documents based on the concept in focus.
 - To show the selected concept in the Resources tab, hover over the concept and select Show in resources
 .
. -
To show the selected concept info, hover over the concept and select Information about this Concept
 .
.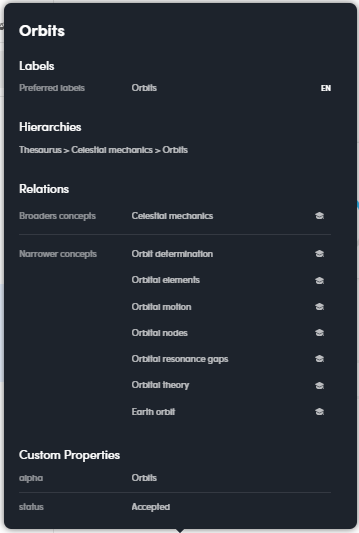
In the pop-up window, the following items are displayed:
- Preferred label and alternative ones (if available)
- Broader concept
- Narrower concepts
- Custom properties
The Documents area reports the:
- Number of project concepts with corresponding percentage.
- Number of extracted and annotated concepts with corresponding percentage.
- Number of documents with:
- Most extractions
- No extractions
Hover over a document and select:
- Annotate document
 to add annotations to a document. You'll see the detail view of the Documents tab.
 - Open document
 to open a document in detail view, hover over the document of interest and select. You'll see the Documents statistics sub-tab. To annotate it, select Annotate documents
  .
.
Note
More information about Annotate document and Open document below.
Resources analytics
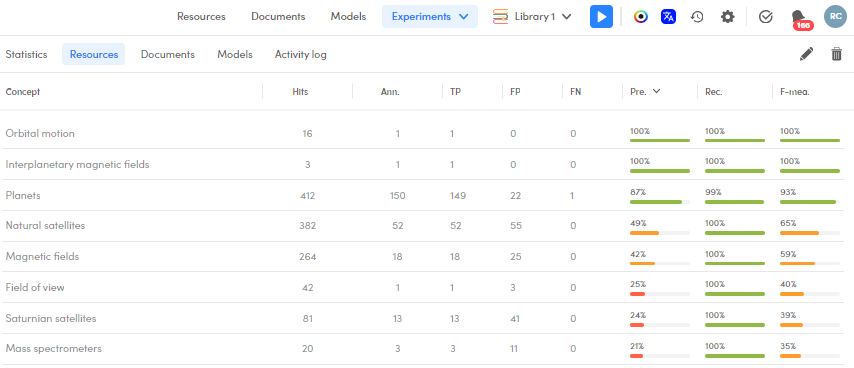
Select the Resources sub-tab to get concept analytics for the current experiment.
The following applies to experiments producing metrics, see also the article about experiments without quality metrics.
This data is shown for each concept:
- Hits: number of extractions
- Ann.: number of annotations
- TP: true positives
- FP: false positives
- FN: false negatives
- Pre.: precision
- Rec.: recall
- F-mea.: F-Measure
Sort the resources
You can sort the list of concepts on the values of a column by selecting the column header and by doing the same again you can reverse the order.
Filter concepts
To filter the list of concepts by their name, type something in the search box at the top right and press Enter: only concepts whose name contains what you typed will be displayed.
To cancel the filter select the X icon  in the search box.
Search documents
If there are metrics, to find the library documents for which a class was predicted, hover over the class and select Search .
You will be brought to the Documents statistics tab already filtered on the selected class.
Show the concept in resources
To see the selected concept in the main Resources tab, hover over the concept and select Show in resources .
Show concept information
To show detail information about a concept, hover over the concept and select Information about this Concept .
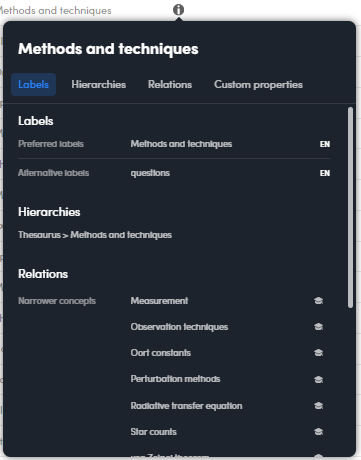
In the pop-up window, the following items are displayed:
- Preferred label and alternative ones (if available)
- Broader concept
- Narrower concepts
- Custom properties
Export resources' metrics
To export resources' metrics to a CSV file select Download  from the toolbar at the top right.
A dialog with two tabs appears. In the default tab, Export, set the name of the file to export and select Export to start producing the file. In the Download tab you can observe the progress of the operation and, once the file is ready, download it. When the file is ready a pop-up will also appear shortly in the bottom right corner of the page.
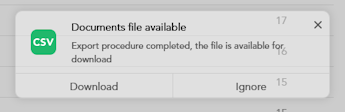
To download the file, select Download inside the pop-up or in the Download tab, next to the file name. The file is downloaded to your browser's download folder.
Inside the CSV file, the field delimiter is the comma (,) and the text qualifier is the quotation mark (").
If you don't need it, you can delete a completed export to free up space by selecting Remove next to the file name.
To leave the dialog select Cancel, when available, or click anywhere outside the dialog.
Check document quality results
Select the Documents sub-tab to check document quality results for the selected experiment. There are two sub-panels:
- Documents with metrics
- Not annotated documents
Annotated documents
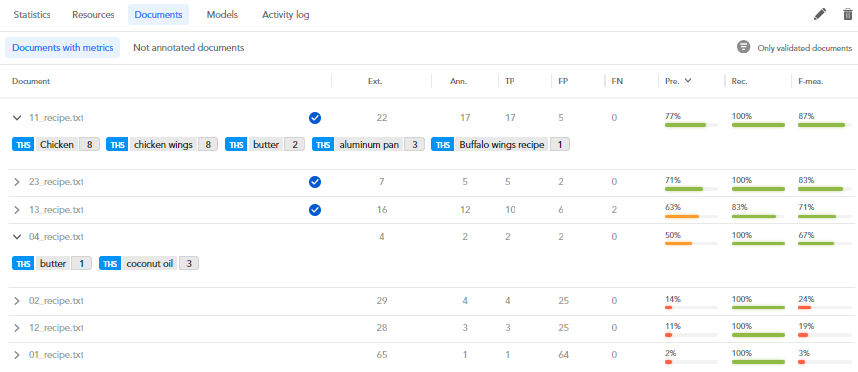
The Documents with metrics sub-panel lists all the annotated documents of your project.
- Select the expanding arrow
 to view all extracted concepts in the document.
 - Select the collapsing arrow
 to collapse all concepts.
For each document, the following items are displayed:
- Document validated mark
 (if the document is validated).
 - Ext. (Number of extractions)
- Ann. (Number of annotations)
- TP (True Positive)
- FP (False Positive)
- FN (False Negative)
- Precision
- Recall
- F-Measure
Sort the documents
To sort the documents based on a specific item, hover over a column header and select the related arrow beside it.
Export documents' metrics
To export documents' metrics to a CSV file select Download from the toolbar at the top right.
A dialog with two tabs appears. In the default tab, Export, set the name of the file to export and select Export to start producing the file. In the Download tab you can observe the progress of the operation and, once the file is ready, download it. When the file is ready a pop-up will also appear shortly in the bottom right corner of the page.
To download the file, select Download inside the pop-up or in the Download tab, next to the file name. The file is downloaded to your browser's download folder.
Inside the CSV file, the field delimiter is the comma (,) and the text qualifier is the quotation mark (").
If you don't need it, you can delete a completed export to free up space by selecting Remove next to the file name.
To leave the dialog select Cancel, when available, or click anywhere outside the dialog.
Open a document and add annotations
To open a document in detail view based on a selected experiment in focus, hover over it and select Open document . The document will open in the detail view.
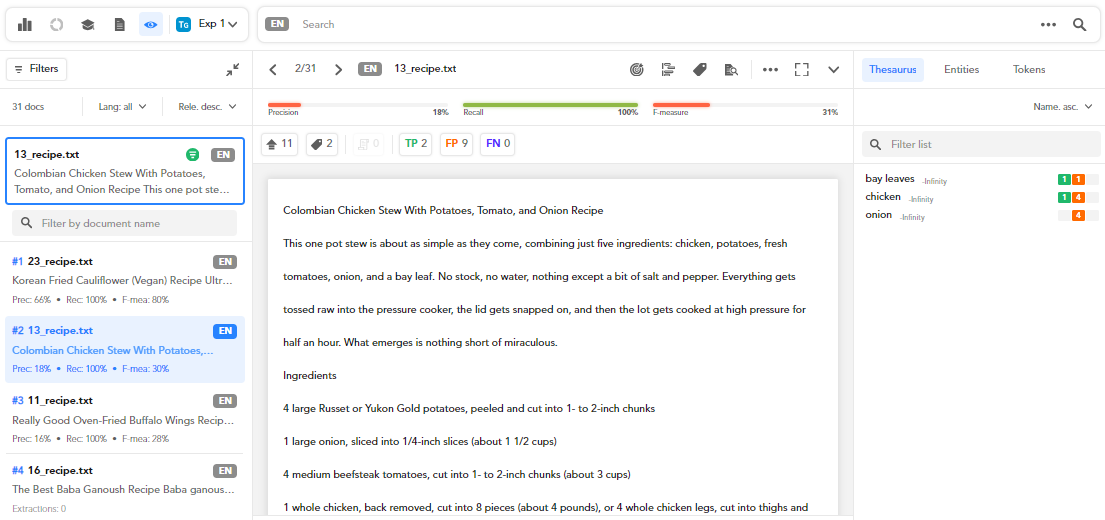
In the selected experiment, Exp 1, the value chicken has four single false positive occurrences in the selected document.
What you see is a record of the document before the latest experiment was performed in comparison with the selected one.
In this view, annotation is not possible. To annotate, select Annotate documents from the toolbar beside the document name. This is what you will see:
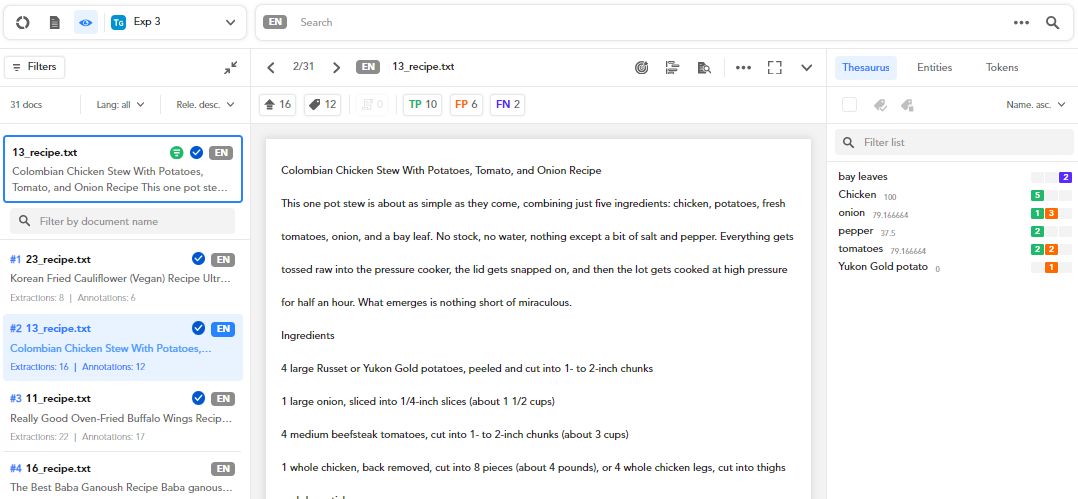
As you can see, the latest experiment—Exp 3— is in focus and the values of chicken are now true positives. This means that after Exp 1 and before Exp 3 the values of chicken have been turned into true positives.
An alternative to see this view while in the experiment dashboard with an experiment in focus is:
- In the Documents with metrics sub-tab, hover over a document.
- Select Annotate document .
Filter validated documents
To filter validated documents, select Only validated documents to get the filter criteria:
 = no filtering.
 = only validated documents.
 = only not validated documents.
Not annotated documents
The Not annotated documents sub-panel lists all the unannotated documents of your project.
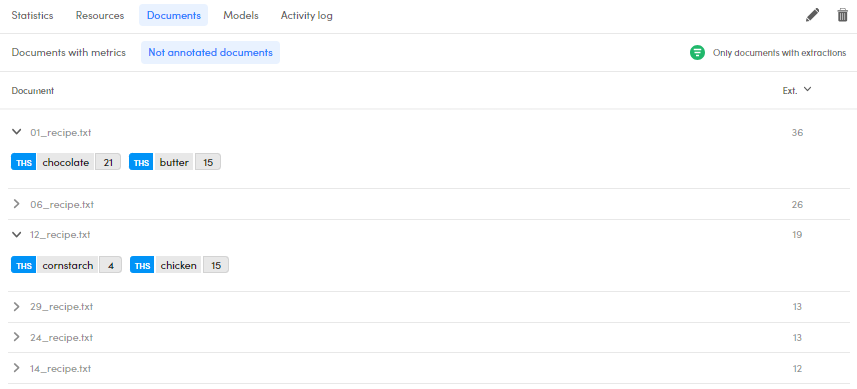
- Select the expanding arrow to view all possible annotations and extractions of the document.
- Select the collapsing arrow to collapse them.
This sub-panel has two columns:
- Document, listing the documents
- Ext. (Extractions), the number of extractions
Sort the documents
To sort the documents based on a specific item, select the related arrows beside the column header.
To add annotations
To add annotations to a document, hover over the document of interest and select Annotate document . You'll see the detail view of the Documents tab.
Open a document in detail view and annotate it
To open a document in detail view, hover over the document of interest and select Open document . You'll see the Documents statistics sub-tab.
To annotate it, select Annotate documents .
Filter documents with extractions
Click the icon beside Only documents with extractions until it turns into one of the following forms:
- to select the positive filter, that means only documents with extractions.
- to select the negative filter, that means documents without extractions.
- means no filter.
Information about models
To read information about the models, select the Models sub-panel.
Activity log
To read information about the logs, select the Activity log sub-panel.
Show the experiment analytics
To show the analytics of an experiment:
- Select an experiment in the Experiments panel.
- Select Documents analytics
 .
.
The data you will see are the same reported in the dedicated page. While there, you can also select:
- Browse documents
 to see the document statistics.
 - Show resources
 to see the experiment resources.