Documents statistics
The documents statistics view of an experiment is very similar to the Documents tab of the project dashboard. The differences are described below.
To access this view from in the experiments dashboard:
- Select an experiment.
- Select Browse documents
 on the toolbar at the top of the left panel.
To access this view for the last experiment from the main toolbar of the project dashboard:
- In the Experiments dropdown menu, select Documents statistics.
Or:
- From the Experiments dropdown menu, select Statistics.
- Select an experiment from the Experiments panel and then select Browse documents .
Quality measures
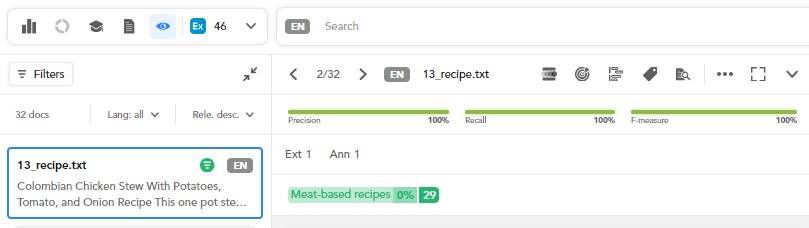
In the list view, for each document with output, the quality measures (precision, recall and F-measure) are displayed below the text abstract.

In the detail view, the quality indicators are shown below the document toolbar.
Filter documents by quality
The presence-absence filter has a Metrics tab which allows you to set quality filters.
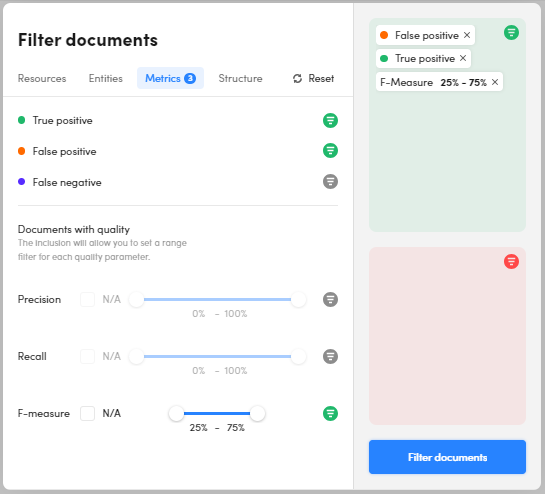
The buttons next to the features are all bi-state.
True positive, False positive and False negative refer to the presence of documents with those characteristics. For example, putting True positive and False negative in the positive part of the filter selects documents in which one or more output categories match annotations and one or more annotations have no corresponding output category.
Slider features correspond to constraints on the values of quality measures. Putting a button in Presence status, the N/A checkbox is activated. If selected, the slider is disabled and the constraint corresponds to an undefined value, which is obtained when the denominator of the measure formula is zero.
By deselecting the checkbox, the slider is activated and it is possible to move the thumbs to modify the range of values.
Search for categories
In both list and detail views you can search for categories based on the experiment results. To do this:
- If in list view, below Resources on the right, or if in detail view, in the Taxonomy panel on the right, hover over a category and select Search
 .
. -
Select:
- Search true positive
 to search for a category as true positive.
 - Search false negative
 to search for a category as false negative.
 - Search false positive
 to search for a category as false positive.
- Search true positive
Or:
-
If in list, select a category below the quality measures.
Or, if in detail view, select a category in the middle of the document text.
-
Repeat step 2 as above.
Alternatively, you can use the search bar hints and codes while typing a category.