Introduction
Tool windows provide functionalities that supplement code editing. They allow you to manage the project structure and show the results of last run, statistics, reports, event logs and much more.
Some of the Studio tool windows come from IntelliJ IDEA, but most of them are specific to Studio.
Those listed below are the tool windows that are specific to Studio or have been customized.
| Name | Description |
|---|---|
| Annotation | Annotations management tool |
| Assistant | Welcome window that offers information about the environment and suggestions how to start to work. |
| Bookmarks | Provides quick access to favorite items and favorites lists management tools |
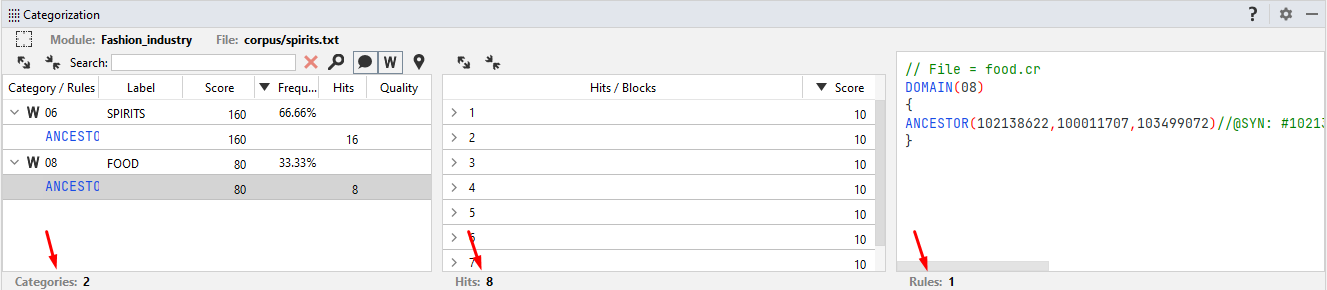
| Categorization | Allows viewing and browsing the categorization results of the last run |
| Classes | Manage the project resources (taxonomy and templates) |
| Console | Build and run messages, debugger dashboard and build information |
| Disambiguation Info | Allows viewing and browsing the relevant disambiguation results of the last run |
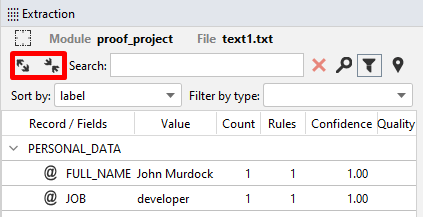
| Extraction | Allows viewing and browsing the extraction results of the last run |
| Find results | Not properly a tool window, it is displayed after a search operation |
| Knowledge Graph | Comprehensive knowledge graph navigation and selection tool |
| Knowledge Graph Search | Small-footprint knowledge graph navigation and selection tool |
| Notifications | List of notifications throughout a Studio session |
| Problems | List problems like possible typos and project errors |
| Project | Operational center for the management of the constituent elements of the project (files, folders, etc.) |
| Report | Summary of the latest run of a multi-document analysis |
| Segments | Allows viewing and browsing the segmentation results of the last run |
| Semantic Analysis | Allows viewing and browsing semantic analysis results of the last run |
| Sentence Hits | Allows viewing and browsing all the results of the last run for selected sentences |
| Statistics | Statistics about the last run |
| Structure | Visual navigable breakdown of the structure of selected project items (rules files, XML files, etc.) |
| Tagger | Allows viewing and browsing tagging results of the last run |
| Terminal | Integrated command prompt |
| TODO | Index of the "to do" and "fix me" reminders you put in your code |
Studio specific tool windows are recognizable because their selection tab contains a spotted grid.

By default, tool windows are attached to the bottom and to the sides of the main window, but they can be rearranged and even detached and used as separate windows. Please refer to the IntelliJ IDEA guide to tool windows for a complete description of the common aspects and functionalities.
The following articles in this section of the manual describe all the relevant tool windows in detail. Here follows a description of functionalities and elements that are common to all or most windows.
Quick access controls
A single click on the tool window selector on the edge of the Studio window opens the tool window.
Hovering over the button at the left of the Studio status bar  displays the list of the tool windows. The same button also acts as a visibility toggle switch for tool windows selectors: a single mouse click hides or displays all the tool windows selectors.
Some tool windows can receive focus by pressing Alt and a number shown in the list of tool windows. For example, Alt-2 sets the focus to the Favorites tool window.
Info
Keyboard shortcuts are re-configurable, so you can associate a keyboard shortcut to Studio specific tool windows, if you wish.
Title bar
When a tool window is open, its title bar contains these buttons on the right:
| Icon | Name | Description |
|---|---|---|
 |
Help | Open the relevant help article in this manual |
 |
Toggle Float | (For some tool windows only) Float the tool window |
 |
Toggle Float | (For some tool windows only) Dock the tool window |
 |
Show Options Menu | Control tool window appearance |
 |
Hide | Minimize the tool window |
Show Options Menu shows a menu with commands to:
- Change view mode
- Move or resize the window
- Remove the tool window tab
If a tool window tab is removed, it can be restored later by selecting it on the View > Tool Windows menu.
The title bar has a context menu with the same commands of the Show Options Menu plus the minimize command.
Depending on the window, the title bar can contain tabs corresponding to window panels.

In this case, the title bar context menu also contains commands to navigate and group the tabs.
Current context
Some tool windows have an area under the title bar showing the name of the current project module.
If the window displays the results of the last run for a test file, the name of that file is shown too, together with the Select Source File button  that allows selecting the file in the editor.

Contents
The contents of a tool window can be organized into one or multiple panels, all of which can be arranged as tabs. Further, each panel can contain sub-panels which can be similarly organized.
The empty space between panels normally acts as a draggable resize control.
Toolbar
Tool window panels have a toolbar usually located at the top of the panel, but there can be exceptions.
Toolbar commands are panel-specific, however commands with the same name and icon perform a similar action in every panel of every tool window. For example, panels that display a hierarchy of elements usually have toolbar commands to fully expand or collapse the hierarchy.
In most cases, toolbar commands may also be accessed from the main menu, from context menu or may correspond to a keyboard shortcut.
Context menu
In every tool window, mouse right-click shows the context menu.
Info bar
Tool windows panel may have its own info bar displaying summary information.
Change notification area
At the bottom of tool windows that show the results of document analysis (Semantic Analysis, Categorization, Extraction, Segments, etc.), notifications appear indicating how the data shown refers to a previous analysis and that a refresh is needed to get updated data.
When a test document is modified, this notification appears:

Note
A similar notification is displayed also in the editing area.
When a rule file is modified, the notification is:
