Debug scripts
The script is the optional program, written in JavaScript like language, with which you can customize the document analysis pipeline.
To debug the script you need to:
- Set at least one breakpoint.
- Enable and use the debugger.
Warning
It is not possible to debug the initialize function.
Breakpoints
IntelliJ IDEA, the platform on which Studio is based, offers advanced breakpoint management.
For example, it is possible to set breakpoints that record a message or write the stack trace to a log file.
It is also possible to have breakpoints that self-cancel once encountered. Please refer to the IntelliJ IDEA documentation if you are interested in breakpoint management options.
The most common operations on breakpoints are described below.
Set breakpoints
To set a breakpoint:
- Open the script file.
- Find the line containing the statement before which you want the execution to stop.
-
Click the gutter at the line.
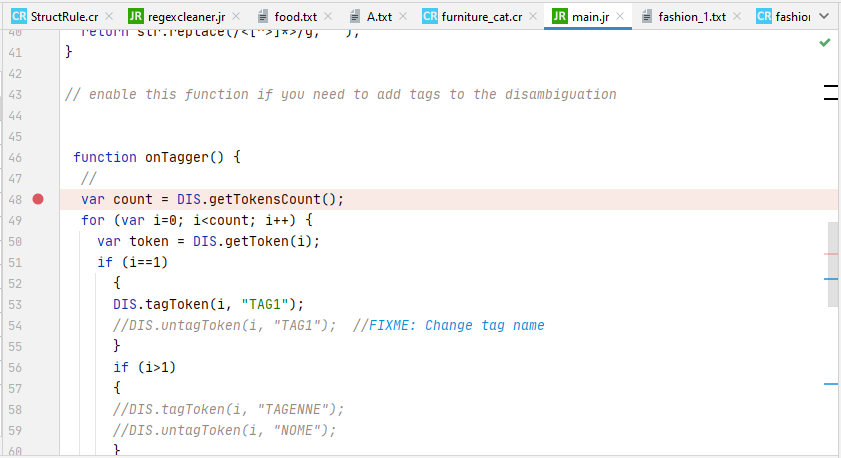
Info
If the gutter shows row numbers, click to the right of the row number.
Toggle breakpoints
Single breakpoint
In the editor, right-click the breakpoint icon and check or uncheck Enabled.
In the Console tool window:
- Select the Breakpoints tab.
- Find the breakpoint and check or uncheck it.
All breakpoints
To disable all breakpoints:
- In the Console tool window, select the Breakpoints tab.
- Choose Disable all Breakpoints
 on the toolbar.
To enable all breakpoints:
- In the Console tool window, select the Breakpoints tab.
- Choose Enable all Breakpoints
 on the toolbar.
Delete breakpoints
Single breakpoint
In the editor, click the breakpoint icon in the gutter.
In the Console tool window:
- Select the Breakpoints tab
-
Select the breakpoint.
Warning
Select the part of the breakpoint line containing the script name and the statement line number, not the left checkbox, that is used to disable and re-enable the breakpoint.
-
Select Delete Selected Breakpoints
 on the toolbar.
Multiple breakpoints
- In the Console tool window, select the Breakpoints tab.
-
Select the breakpoints to be deleted. Multiple selection is possible.
Warning
Select the part of the breakpoint line containing the script name and the statement line number, not the left checkbox, that is used to disable and re-enable the breakpoint.
-
Select Delete Selected Breakpoints
on the toolbar.
Find breakpoints in the source code
- Open the Bookmarks tool window.
- Expand Breakpoints then expand Script Line Breakpoints.
-
Double-click a breakpoint.
Or:
Press
F4.
Or:
- On the toolbar, select Show Options Menu
 > Navigate with Single Click.
 - Select the breakpoint.
Debugger
Note
During a debug session, debugger commands are available both in the main toolbar and in the Debugger tab of the Console tool window.
Enable the debugger
- Select Studio > Enable Script Debugger on the main menu.
Or:
- Select Enable Script Debugger
 on the main toolbar.
Or:
- Open the Console tool window.
- Select the Debugger tab.
- Select Enable Script Debugger on the toolbar.
Disable the debugger
- Select Studio > Disable Script Debugger on the main menu.
Or:
- Select Disable Script Debugger
 on the main toolbar.
Or:
- Open the Console tool window.
- Select the Debugger tab.
- Select Disable Script Debugger on the toolbar.
Start debugging
Document preparation and analysis operations run the script on each file they process.
Run the command you need and, if the debugger is enabled and at least one breakpoint is set and enabled, the execution of the script will stop before the execution of the statement on which the first breakpoint is defined.
The editor will show the script file with the breakpoint line highlighted.
The debugger requires inbound TCP/IP connectivity which Windows Defender Firewall blocks by default. The first time you use the debugger the Windows Defender Firewall prompt appears.
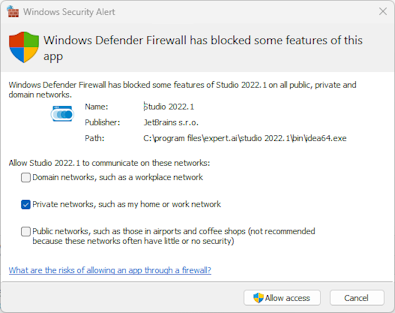
To use the debugger allow Studio to communicate on private networks.
Resume execution up to the next breakpoint
To resume the execution of the script up to the next breakpoint, or to the end if no other breakpoint is encountered, select Resume  .
.
Resume execution ignoring all breakpoints
To resume the execution of the script to the end, ignoring breakpoints, select Resume ignoring all breakpoints  .
.
Pause execution
To pause the execution select Pause  .
.
Note
When pausing execution, it is not possible to know in advance the statement before which the execution will stop.
Terminate execution
To terminate the execution of the script so that subsequent statements are not executed, select Stop  .
.
Step over
To execute the current statement without stepping into functions select Step Over ![]() .
.
Step into
To execute the current statement stepping into functions select Step Into ![]() .
.
Step out
To execute all the remaining function statements, stopping on the first statement of the caller immediately after the function call select Step Out ![]() .
.
Show the next statement
To show the next script statement in the editor select Show Execution Point  .
.
Inspect the value of variables
The local variables are shown in the Variables panel of the Debugger tab.
To expand or collapse structured items like objects or arrays, use the expand/collapse toggle button to the left of the item.
To copy the value of a variable or variable member to the clipboard, right-click the item and select Copy Value.
Watches
Watches are variables or expressions you choose to monitor during debugging.
Use the Watches sub-panel of the Debugger panel inside the Console tool window to observe and manage watches.
Create a watch
To create a watch for a variable, in the Variables panel, right-click the variable and select Add to watches.
To create a watch for an expression:
- In the Watches panel select Create
 on the toolbar.
 - Enter the expression and press
Enter.
Edit a watch
To edit a watch, in the Watches panel:
- Double-click the watch to edit.
- Change the expression and press
Enter.
Or:
- Select the watch to edit.
- Select Edit
 on the panel toolbar.
 - Change the expression and press
Enter.
Copy the value of a watch to the clipboard
To copy the value of a watch to the clipboard, right-click the watch and select Copy Value.
Delete watches
To delete a single watch, select the watch, then select Delete  on the panel toolbar.
To delete all watches, select Delete all on the panel toolbar.
View the call stack
To view the call stack:
- Open the Console tool window.
- Select the Debugger tab. The call stack is shown in the Callstack panel and it's automatically updated .