Check extraction quality
Similar to categorization, if you want to assess the quality of the extraction functionalities of your project, you have first to set target results. This is accomplished by annotating target extractions for test documents.
Once the targets have been set, they are automatically checked by Studio after every analysis. Studio compares actual results with the targets and reports concordances and discrepancies through various outputs.
Single document analysis
After the analysis of a single test document, quality information is displayed:
-
At the bottom of the editor.
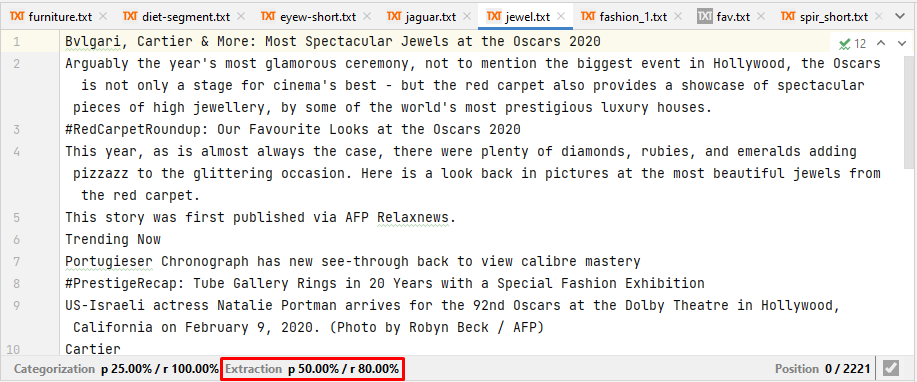
The values shown are precision and recall. They are computed with respect to all the documents's extraction targets.
-
In the Extractions tab of the Annotation tool window.
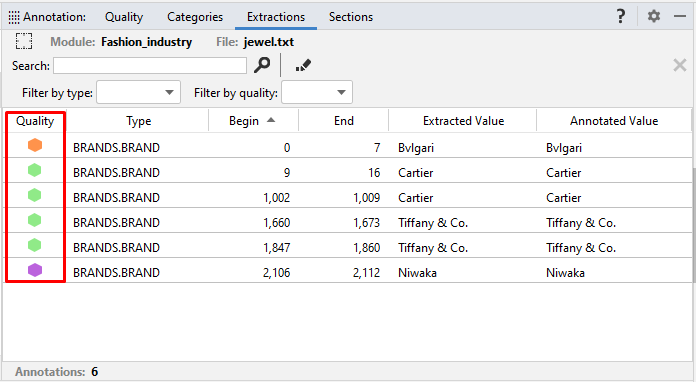
Here quality information is visual and by target.
-
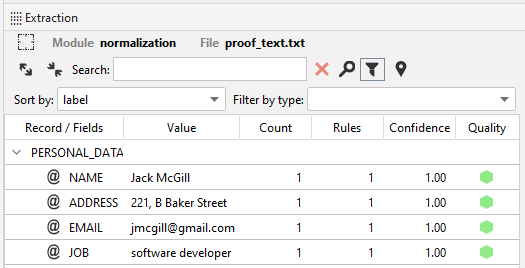
In the Extraction tool window.
-
At the aggregated result level.
-
At the extraction detail (hits) level.
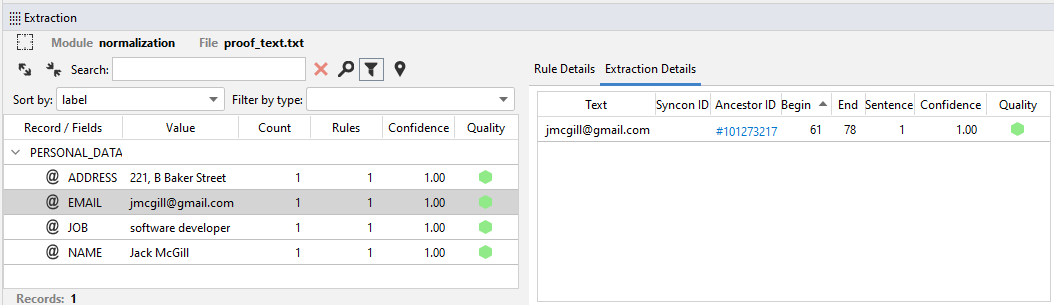
Here quality information is visual and by result.
-
All-document analysis report
After an all-document analysis, a report is produced showing overall and by-document quality indicators.
It is shown as a table in the Report tool window. By default both categorization and extraction indicators are shown.
To display analysis reports choose ANALYSIS in the Filter list on the first panel toolbar.
Note
The report will be produced only if there is more than one test document in the project.
The report is an XML file located in the analysis sub-folder of the reports folder that you can easily inspect in the Project tool window.
Overall indicators
Extraction quality indicators for all reports are displayed by default.
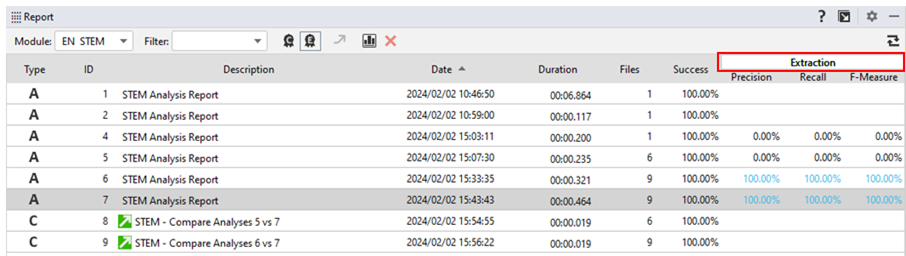
To turn them on and off select Extraction Quality Data  on the toolbar. The button acts as a toggle switch.
Report indicators for documents
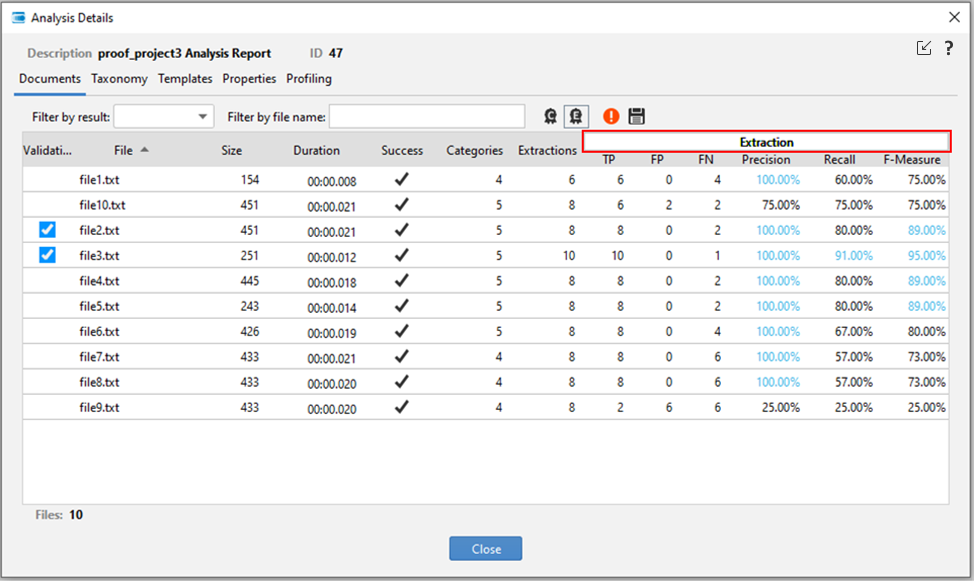
Extraction quality indicators for documents are displayed by default in the report's detail window.
To display extraction indicators for report's documents:
- Double-click a report.
Or:
- Select a report then select View Reports
 on the toolbar.
To turn indicators on and off, in the Analysis Details window, Documents tab, select Extraction Quality Data . The button acts as a toggle switch.
- To sort report entries, select the column header.
- to display or hide the error column, select Error Column
 .
. -
To export a report, select Export CSV
 . Exported files are stored alongside the original XML report files in the
 analysissub-folder of thereportsfolder.Tip
If you export the reports in CSV format you can use an external tool, such as a spreadsheet software, to analyze the data.
Report indicators for templates and fields
To display extraction quality indicators for templates and fields:
- Double-click a report.
Or:
- Select a report then select View Reports on the toolbar.
- Select the Templates tab.
To export the template list in .csv format with annotations, results and metrics, select Export CSV on top of the upper area.
Template names are grayed out while field names are separated from the template by a slash.
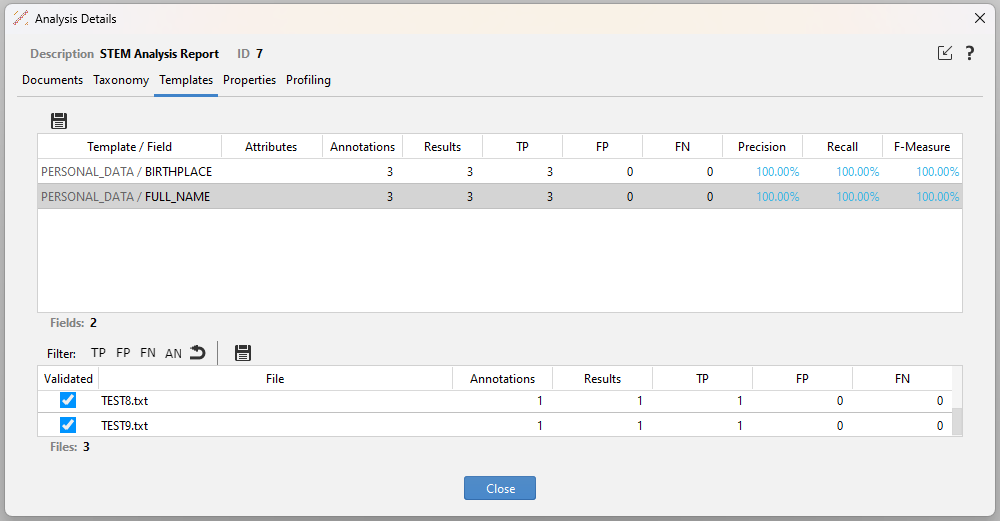
Use the lower area to filter related-category documents according to their hits:
- To filter documents true positives, select TP.
- To filter documents containing false positives, select FP.
- To filter documents containing false negatives, select FN.
- To filter documents containing annotations, select AN.
- To reset the filters, select Reset filters
 .
.
To copy the listed files in a sub-folder under the test folder:
- Select Create Subset of Files .
- In Browse for Folder select the sub-folder where you want to save the copy of your files. In case of no sub-folders, select New Directory
 and give your folder a name.
Note
- The
testfolder is set by default. - The other simple commands help you organize the folder management.
Trend
To check if the quality of your project is improving—a progress—, remaining stable or getting worse—a regression—, perform an all-document analysis every time the development reaches a milestone, possibly giving a meaningful name to the analysis report to indicate which milestone it refers to.
Info
Studio automatically keeps track of the time when all-document analysis is performed and assigns an ID to the report.
This info is displayed in the Date and in the ID column of the Report tool window, so that you can always distinguish between different reports even if they have the same name.
Then, to assess the trend between two all-document analysis, use their reports to create a comparison report.
Delete reports
To delete a report using the Report tool window.
- Select the report.
- Choose Delete Reports
 on the toolbar of the first panel.
Or:
- Press
Del.
You can also remove a report, both the XML file and possible exports in CSV format, by deleting the files form the Project tool window.
Repeat report
To repeat an analysis report based on a previous one using the Report tool window, right-click the report and select Repeat Analysis.
If you add new documents before the new report, they will not be considered in the analysis. If you delete documents previously analyzed in the previous selected report, the new report will contain the documents in common between the old and the new report.