Statistics
Overview
This tool window contains advanced information regarding the last analysis operation.
By default this tool window is not shown. To display it, set Studio > Studio Settings > General > Enable Analysis Debug Info to true.
This tool window has two tabs:
- Time statistics
- Slowest attributes
Various information is reported in the upper side of the tool window:
- Text, Dis, CTX file sizes
- Presence or absence of annotations
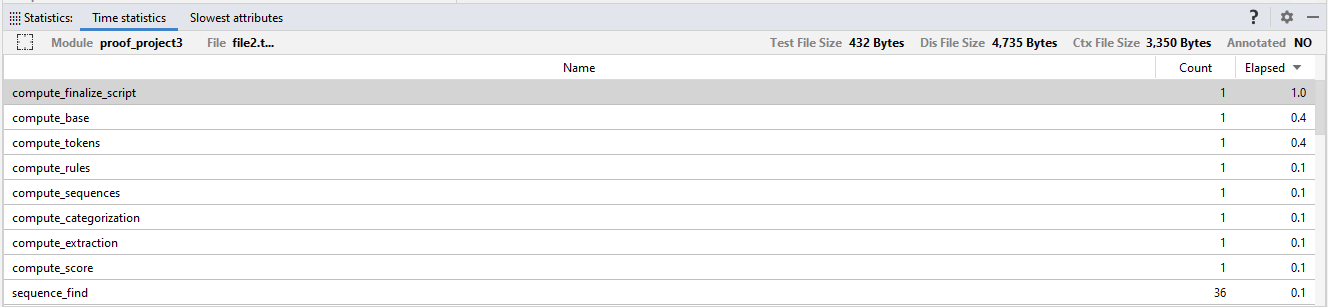
Time statistics
The data presented in this panel is useful for support personnel to diagnose the cause of issues such as excessively long analysis times. The interpretation of these data, therefore, is beyond the scope of this manual.
Slowest attributes
The Slowest attributes tab shows the ten slowest operands affecting file analysis time.
Note
To view results in this table, in the Studio Settings, General group, set Enable Analysis Debug Info to true.
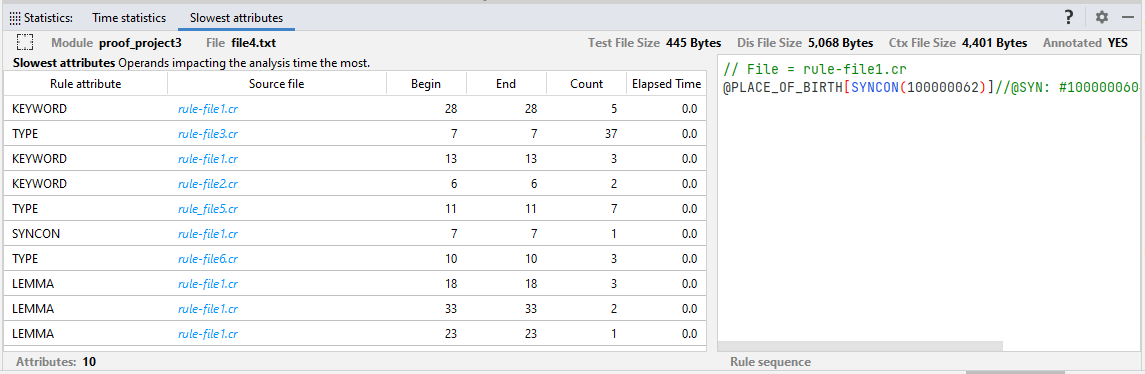
This tab has two panels: one on the left showing you the slowest attributes and one on the right, which is a rule preview panel.
The panel on the left has the following columns:
| Name | Description |
|---|---|
| Rule attribute | Attribute of the rule |
| Source file | Rule source file |
| Begin | Rule beginning line number |
| End | Rule ending line number |
| Count | Number of rule hits |
| Elapsed Time | Extra elapsed time |
The right panel shows a preview of the selected rule on the left one.
Note
Text selection is available in the right panel.
A context menu is available in the right panel:
| Command | Description |
|---|---|
| Copy All Text | Copy the entire rule |
| Select All Text | Select the entire rule |
| Copy Selected Text | Copy the selected text |
- Double-click one of the attributes on the left panel to jump to the source file.
- To sort the attributes according to a column header, select a column header.
Note
You can also find the ten slowest attributes in the .ctx file of the gen folder introduced by "attr_stats".