Debugger
The Debugger panel of the Console tool window allows debugging the optional script that is executed during analysis.
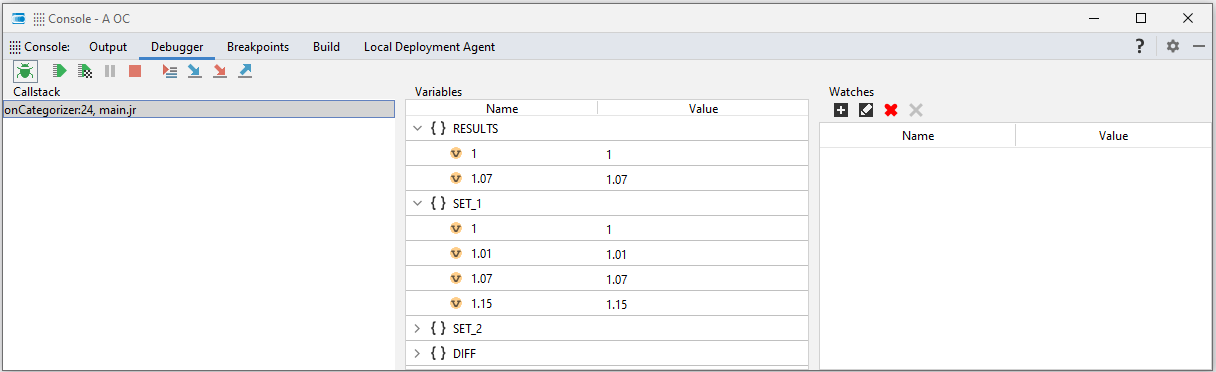
The panel contains these sub-panels:
- Callstack
- Variables
- Watches
Callstack
This panel shows the list of active functions.
The function that's being executed is shown at the top of the list. If it was called from another function, that other function is shown below and so on, recursively, if there are other calling functions pending.
The information reported for each function is:
- Function name
- Current line number
- Script file name
Variables
This panel shows the variables that are defined in the function that's being executed along with their value.
If a variable is structured, an expand/collapse toggle switch to the left of its name allows displaying or hiding the variable's members and the same applies to structured members.
The context menu command are:
| Name | Description |
|---|---|
| Add to watches | Add the variable—or variable's member—to watches. |
| Copy Value | Copy the value of the variable—or variable's member—to the clipboard. |
Watches
This panel allows managing watches. A watch can be set to observe the value of a variable or of an expression referencing variables. Watches definitions are remembered between subsequent analyses.
The toolbar contains:
| Icon | Name | Description |
|---|---|---|
 |
Create | Define a new watch |
 |
Edit | Edit the selected watch |
 |
Delete | Delete the selected watch |
 |
Delete all | Delete all watches |
The Name column header can be clicked to change sort order.
The context menu command Copy Value copies the watch value to the clipboard.
Toolbar
The Debugger tab toolbar contains:
| Icon | Name | Description |
|---|---|---|
 / /  |
Enable Script Debugger, Disable Script Debugger | Enable and disable the debugger |
 |
Resume | Resume the execution of the script up to the next breakpoint or to the end if no other breakpoint is encountered |
 |
Resume ignoring all breakpoints | Resume the execution of the script to the end, ignoring breakpoints |
 |
Pause | Pause the execution of the script |
 |
Stop | Terminate the execution of the script, subsequent statements are not executed |
 |
Show Execution Point | Show the current script statement in the editor |
| Step Over | Execute the current statement without stepping into functions | |
| Step Into | Execute the current statement stepping into functions | |
| Step Out | Execute all the remaining function statements stopping on the first statement of the caller immediately after the function call |
Info
During a debug session, the commands of this toolbar are replicated in the main toolbar.