Analyze test documents
Analyzing the test documents is the key activity to:
- Check how your project performs.
- Examine the results.
- Decide how to keep developing and fine-tuning the rules and any script.
- Check if the project is ready to be deployed.
Each analysis operation submits the single document to the entire processing pipeline, excluding the preparation.
When it involves multiple documents, the analysis produces reports that can be compared to determine if the quality of the project improves, gets worse or is stable as the rules change.
If the Notification Sound parameter is set to true, a notification sound warns you after the analysis is over. This happens for:
Info
The analysis operation automatically determines whether the code has changed since the last run and in case performs a build. Check the Console and Notifications for any possible compilation errors.
Note
The standard text size is 500 KB, extendable to 2 MB in the configuration properties.
Analyze the document in focus in the editing area
To analyze the document in focus in the editing area:
- In the main toolbar, select Analyze Document
 .
.
Or:
- From the main menu, select Studio > Analyze Document.
Or:
- Press
F5.
Or:
- Right-click anywhere in the text and choose Analyze Document.
A notification is displayed in lower right corner.
You cannot analyze test files in the documents folder. Such a folder is used for document preparation. If you perform an analysis, a warning will appear asking you to start the document preparation.

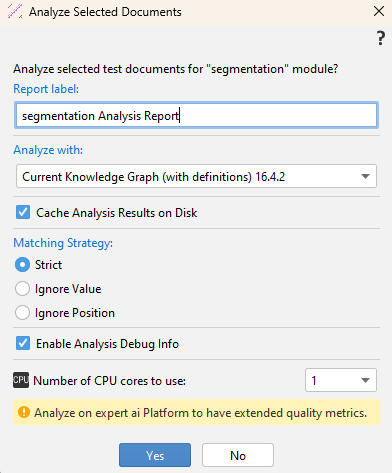
Analyze a selection of documents in the module or project
To analyze a selection of documents in the module or project:
- Select a file or a set of files (
CTRL+clickis allowed) or a folder. - Select Analyze Selection in the context menu.
- Type a report name under Report label or confirm the suggested one.
-
From the Analyze with drop-down menu, select:
- Current Knowledge Graph (with definitions) versionNumber to analyze documents with the current knowledge graph and disambiguator.
Or:
- KG Runtimes versionNumber to analyze documents with the current version of the knowledge graph but a different version of the disambiguator.
-
Check Cache analysis results on disk to cache results on disk.
-
Select one of the available matching strategies. They are used to match the resulting categories and extractions with their corresponding annotations.
Note
Matching strategies are the same described in Platform official documentation.
-
Check Enable Analysis Debug Info to display debug information in the Statistics tool window when analyzing a selection of documents.
Note
This can also be set in the configuration properties.
-
In Number of CPU cores to use, select the number of CPU cores to use to speed up the analysis time.
Note
This can also be set in the configuration properties. See the dedicated page for details.
-
Select Yes or press
Enter.

Tip
Use Platform for more detailed quality metrics.
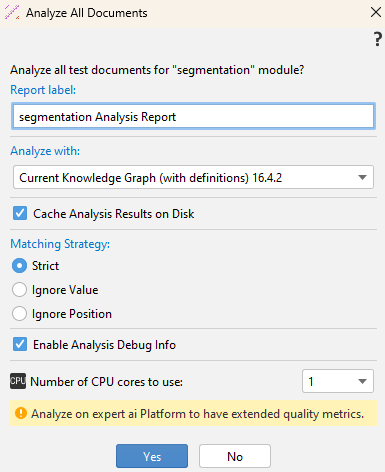
Analyze all the documents in the module or project
To analyze all the documents in the module or project:
-
In the Project tool window, from context menu, select Analyze All Documents.
Or:
From the main menu, select Studio > Analyze All Documents.
Or:
In the main toolbar, select Analyze All Documents
 .
. -
Type a report name under Report label or confirm the suggested one.
-
From the Analyze with drop-down menu, select:
- Current Knowledge Graph (with definitions) versionNumber to analyze documents with the current knowledge graph and disambiguator.
Or:
- KG Runtimes versionNumber to analyze documents with the current version of the knowledge graph but a different version of the disambiguator.
-
Check Cache analysis results on disk to cache results on disk.
-
Select one of the available matching strategies. They are used to match the resulting categories and extractions with their corresponding annotations.
Note
Matching strategies are the same described in Platform official documentation.
-
Check Enable Analysis Debug Info to display debug information in the Statistics tool window when analyzing a selection of documents.
Note
This can also be set in the configuration properties.
-
In Number of CPU cores to use, select the number of CPU cores to use to speed up the analysis time.
Note
This can also be set in the configuration properties. See the dedicated page for details.
-
Select Yes or press
Enter.

Select View Report in the notification at the right bottom corner, to display the analysis report in the Report tool window.

While multiple documents are analyzed, select Abort Analysis  on the toolbar to stop the analysis. A dialog will appear for confirmation.
Tool windows and analysis output
The tool windows affected by the analysis process are:
- Categorization: displays categorization results.
- Extraction: displays extraction results.
- Semantic Analysis: displays the semantic analysis of the test document.
- Sentence Hits: displays sentence hits for categorization and extraction rules.
- Disambiguation Info: displays disambiguation information in addition to semantic analysis.
- Console: displays analysis messages.
- Notifications: displays analysis events notifications.
- Tagger: displays tags.
- Segments: displays segments.
- Report: displays multi-document analysis reports.
- Statistics: displays troubleshooting statistics.