Experiments dashboard
To display the experiments dashboard, select:
- Dashboard in the Experiments drop-down menu.
Or:
- Dashboard in the Experiments panel if you are viewing the Statistics tab of an experiment.
Note
To display the Dashboard panel, it is necessary to have more than two experiments. If you have two experiments in list, it will be possible to display just the Experiments comparison.
The Dashboard panel shows a series of analytics useful to understand the overall experiments quality and trend and its visual form depends on the performed experiment number.
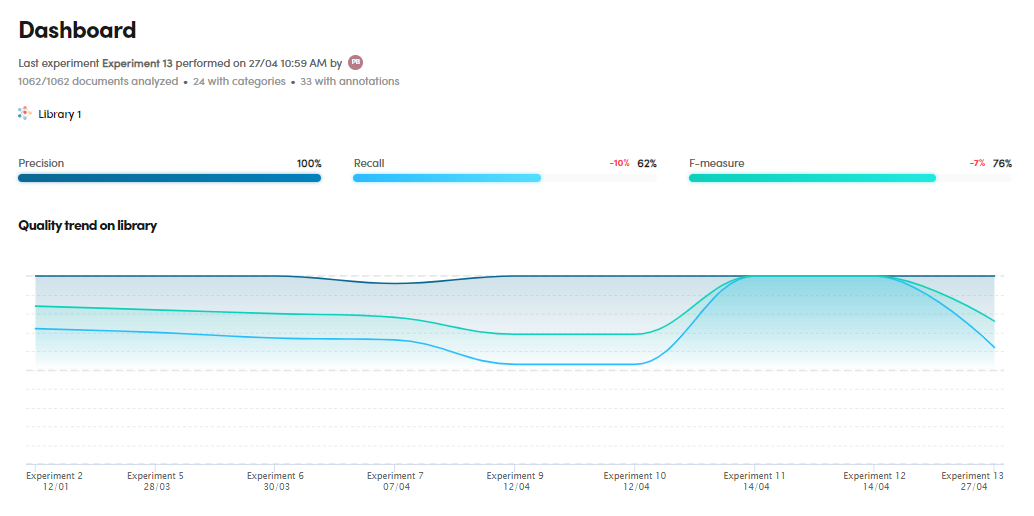
Last experiment quality
On top of the panel you can see the last experiment performance date and time, the author, the analyzed documents, the documents with categories, with annotations, the library used, Precision, Recall and F-measure metrics.
Overall quality trend on library
To check the overall quality trend on library, in the dashboard upper part:
- Watch the charts under Quality trend on library.
- Hover over the lines of the chart to find out the metrics details of the single experiments.
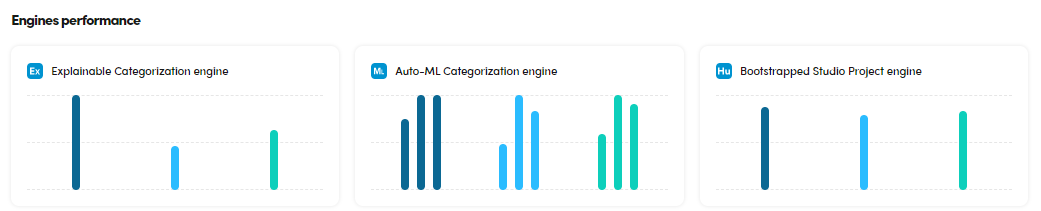
Engines performance
To check the engines performance performance, in the dashboard upper part:
- Watch the charts under Engines performance.
- Hover over the bars of the charts to find out the metrics details of the single experiments.
Experiment list
The experiment list displays a summary of the experiments features and their main quality indicators.
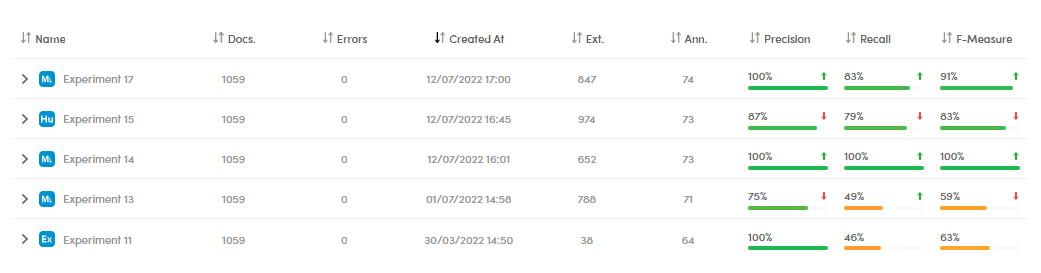
For more information about the training library of the single experiment, select the expanding arrow 
To sort the experiment list, ascending or descending, according to an item, select the arrows placed beside the column header.
Library coverage
to check the library coverage, watch the charts under Library coverage in the dashboard lower part.
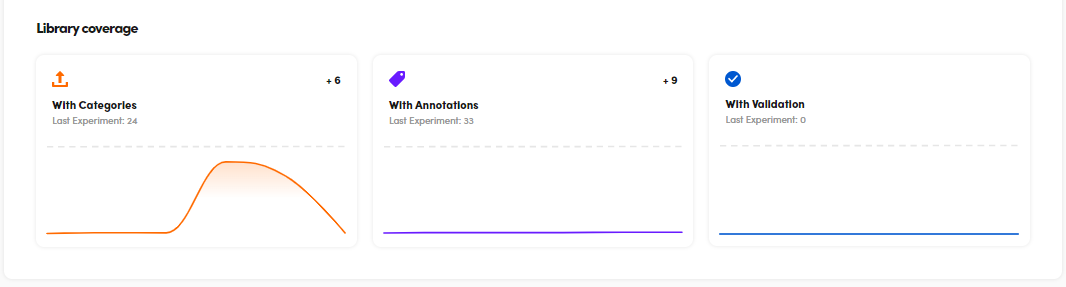
You can watch the:
- With Categories chart.
- With Annotations chart.
- With Validation chart.
Hover over the graphs to find out the data details for each experiment.
Note
According to the number of experiments, this chart can have different visual formats.
Compare experiments
To compare experiments, see Experiments comparison.
Show a specific experiment
To display a specific experiment, select it in the Experiments left panel.