Experiment dashboard
Overview
To display the dashboard while viewing the statistics of an experiment:
- In the Experiments panel, select Dashboard.
Or:
- From the Experiments drop-down menu, select Dashboard.
Note
To display the full Dashboard panel it is necessary to have at least five experiments. If you have two experiments in list, it will be possible to display just the Experiments comparison. On the other hand, in case of three or four experiments in the list, the dashboard has a partial view form. Anyway all the views have the same information.
The dashboard shows a series of analytics useful to understand the overall experiments quality and trend.
Note
The dashboard takes on different graphic forms depending on the number of experiments performed.
Last experiment quality
On top of the panel you can see the quality and information about the last experiment.
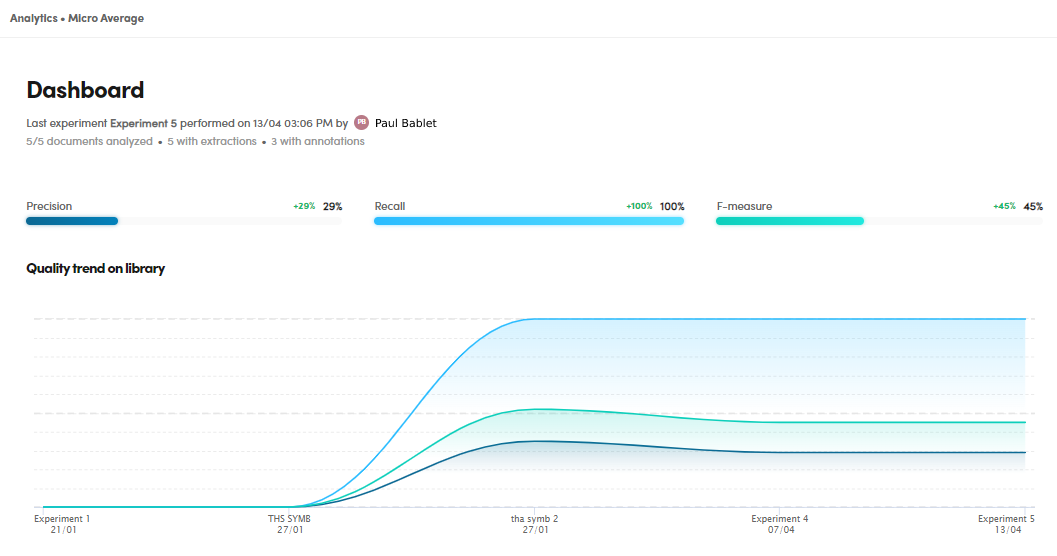
Overall quality trend on library
To check the overall quality trend on library, in the dashboard upper part:
- Watch the charts under Quality trend on library.
- Hover over the lines of the chart to find out the metrics percentages throughout the experiments.
Experiment list
The experiment list displays a summary of the experiments features and their main quality indicators. While Ext. represents the number of extractions, Ann. represents the number of annotations.
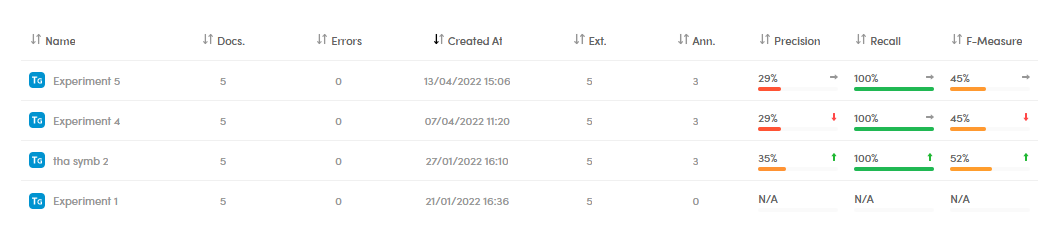
To sort the experiment list, ascending or descending, according to an item, select the arrows beside the column header.
Library coverage
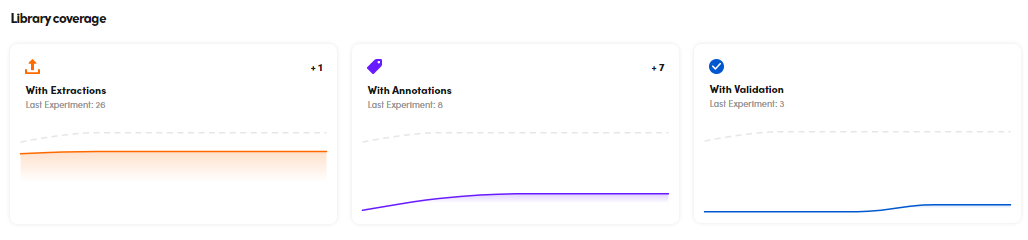
To check the library coverage, in the dashboard lower part, watch the charts under Library Coverage:
Hover over the charts lines to find out the number of documents with extractions, annotations and validation.
Note
Based on the number of experiments, the Library Coverage area can have a different visual form.