Experiments comparison
Overview
If you want to compare the results and the quality of the experiments, either while you're in the dashboard or while watching the statistics of a single experiment:
- In the Experiments panel, select Compare experiments results
 .
. - Select the experiments you want to compare.
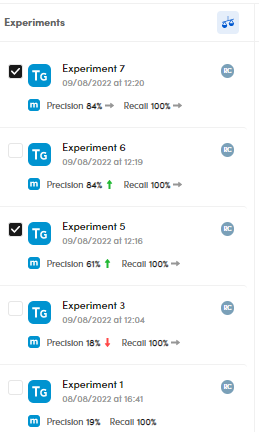
The Compare Experiments panel is displayed and takes a different visual format depending on the selected experiments.
Note

As you can see, the compared experiments are also visible in a row.
- Select the down arrow
 to open the experiment drop-down menu and choose another experiment to be compared.
 - Select Swap runs
 to swap the experiments (only when comparing two experiments).
 - Select Close to stop the comparison and view the experiments dashboard.
Compare two experiments
The panel displays the model type, the experiments names, date and time.
Compare the quality indicators
To compare the quality indicators, check the Precision, Recall and F-measure charts.
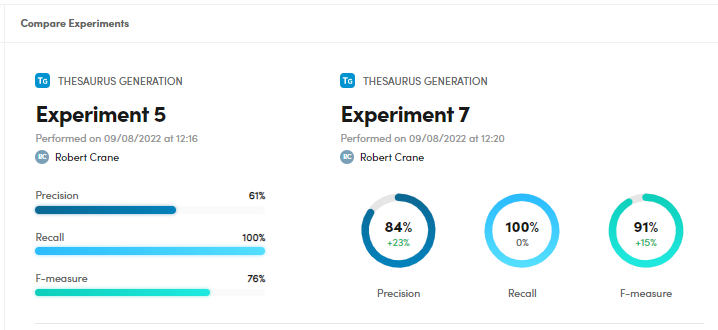
You can also check the differences in percentage (delta) between the two experiments.
Compare the test library coverage
To compare the test library coverage, check the charts under Test library coverage.
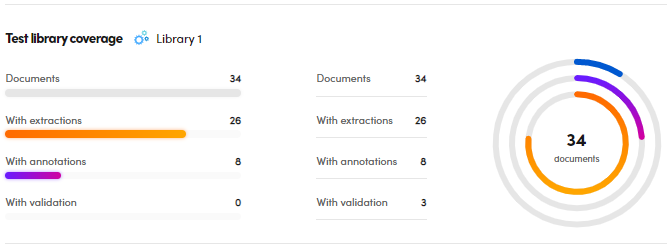
You can check the differences in terms of documents, documents with extractions, with annotations and with validation.
You can also check the differences in percentage (delta) between the two experiments.
Compare the extracted concepts
To compare the extracted concepts by the model, check the Extracted concepts lists and charts under Resources.
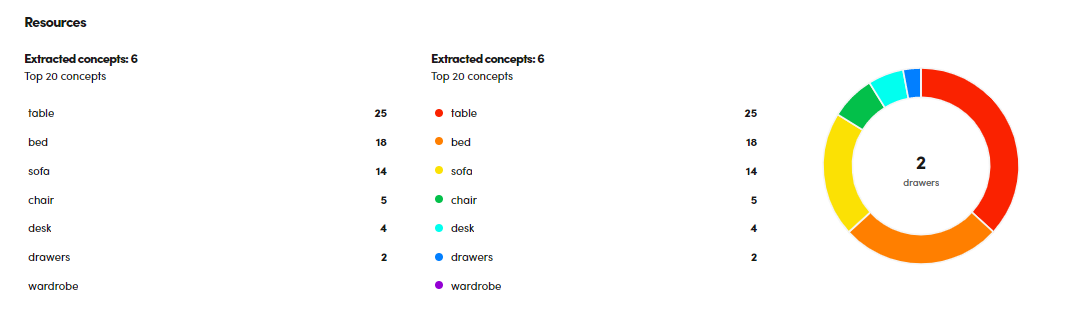
You can also check the differences in percentage (delta) between the two experiments.
Search for documents based on a concept
To search for a set of documents categorized with a specific concept, hover over the concept of interest and select Search  .
.
The Documents statistics tab is displayed.
Display a concept information
To display information about a concept, for example broader concept, preferred label, alternative label, related concepts, hover over the concept of interest and select Show information. 
Display the concepts in the Resources tab
To display a concept in the Resources tab, hover the over the concept of interest and select Show in resources. 
Compare three or four experiments
If you compare three or four experiments, the visual representation of the upper part will be the same of the dashboard.
The lower part is about the library coverage and has a different look from the comparison of two experiments.
To compare the library coverage:
- In the lower panel part, check the charts under Library coverage.
- Hover over the charts bars to know the details.
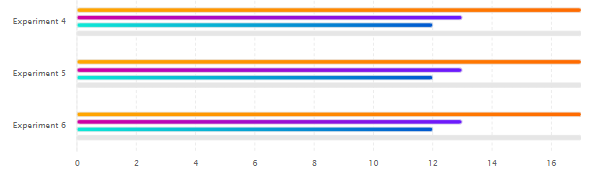
The orange bar indicates the documents with extractions, the violet one those with annotations and the turquoise one those with validations. The gray line indicates the total number of documents.
Compare more than four experiments
In case of more than four experiments selected, the display has the same form of the dashboard panel.