Experiments comparison
Overview
If you want to compare the results and the quality of the experiments, if you are:
- In the dashboard
Or:
- In the Statistics tab
The procedure is:
- In the Experiments panel, select Compare experiments results
 .
. -
Select the experiments you want to compare.
The selected experiments are displayed also in the upper toolbar.

- Select the down arrow
 to open the experiment drop-down menus and choose the experiments to be compared.
 - Select Swap runs
 to swap the experiments (only when comparing two experiments).
 - Select Close to stop the comparison and view the experiments dashboard.
Info
It is possible to compare experiments performed with different engine types.
Depending on the number of experiments selected, the display mode changes.
Compare two experiments
If you compare two experiments, the Statistics • Preferred metrics tab and the Models tab are displayed.
Note
The tab label Statistics • Preferred metrics depends on the preferred metric set in the project settings.
For example, if you selected Sample Average, the tab label has the following format:
Statistics • Preferred metrics
The Statistics • Preferred metrics tab displays the model types, the experiments names, date, time and author.
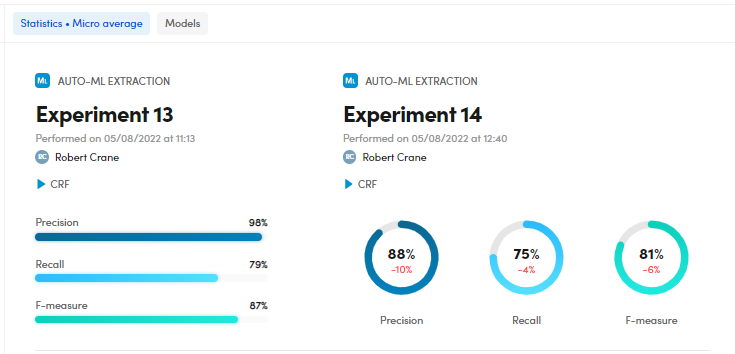
Compare the quality indicators
To compare the quality indicators, check the Precision, Recall and F-measure charts.
You can also check the differences in percentage (delta).
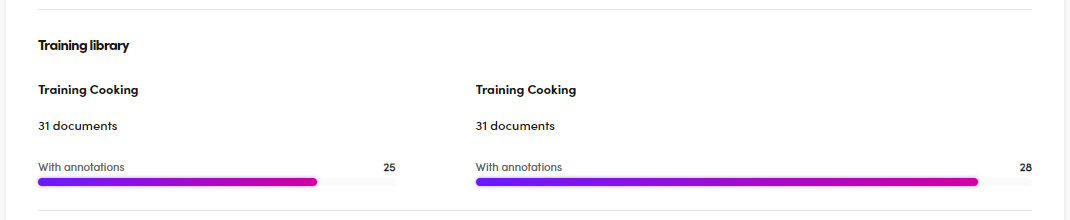
Compare the training library
To compare the training library in terms of documents with annotations, check the Training library area.
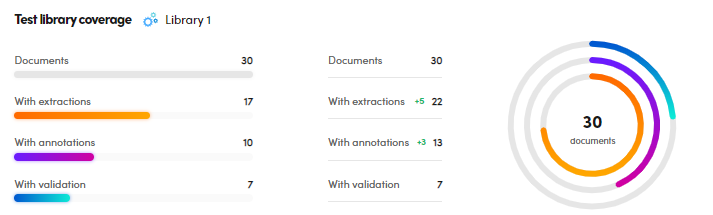
Compare the test library coverage
To compare the test library coverage, check the charts in the Test library coverage area.
You can check the differences in terms of documents, documents with extractions, with annotations and validated documents and also the differences in number of variations (delta).
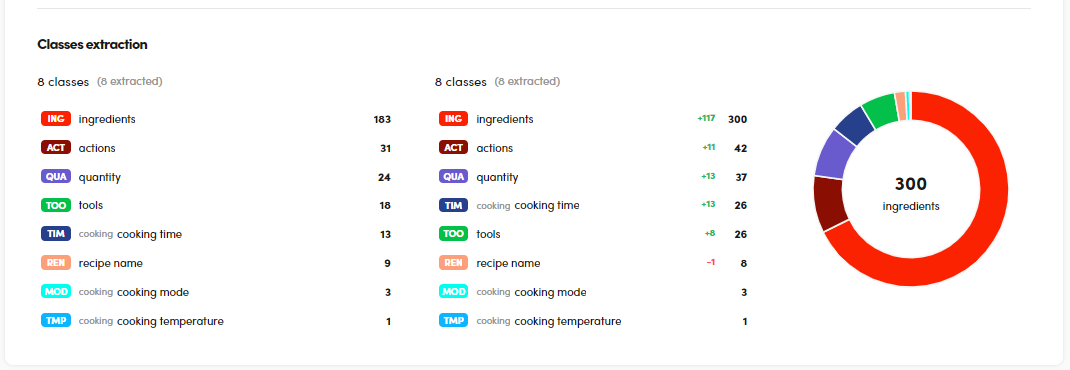
Compare the classes extraction
To compare the classes extraction, check the lists and the chart in the Classes extraction area.
- Hover over the class of interest and select Search
 to search for a set of documents containing that specific class. This action displays the Documents statistics tab.
 - Hover over the class of interest and select Show in resources
 to view the Resources tab.
Display the resources summary of the experiments in comparison
Select Show resources  to display the resources summary of the experiments in comparison and the related statistics and metrics.
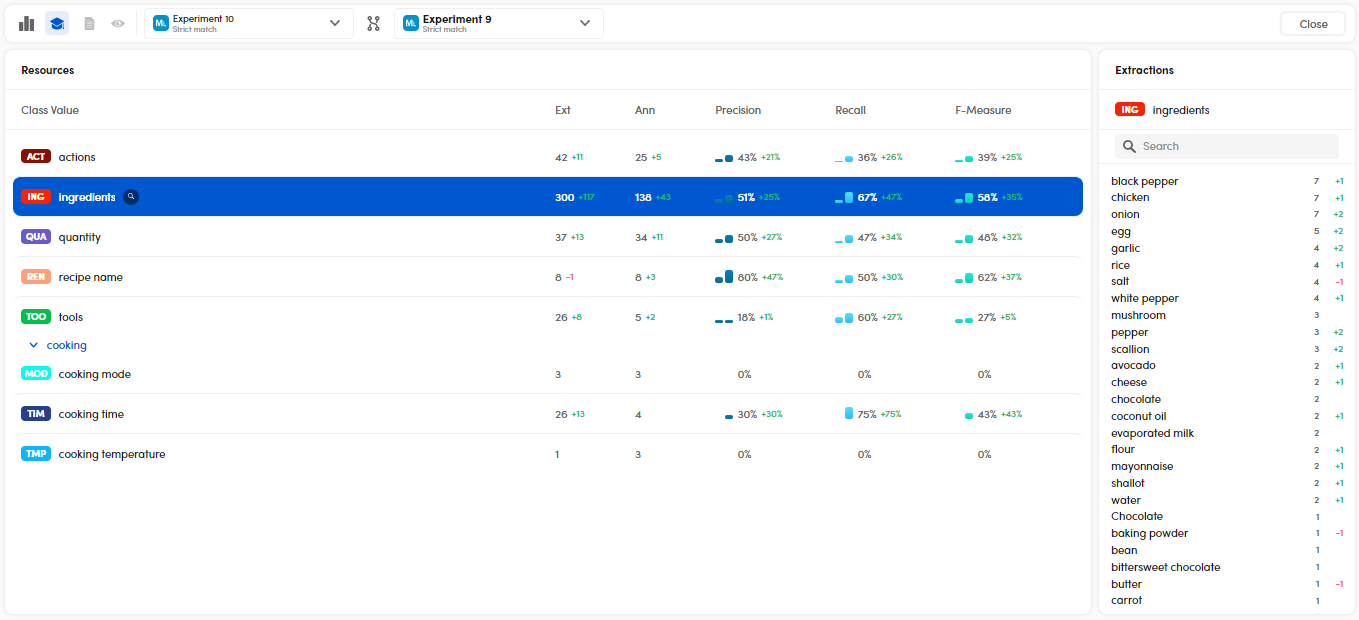
The view is composed of the Resources and Extractions panels.
In the Resources panel you can:
-
Check the class list and the related statistics and metrics like extractions (Ext), annotations (Ann), Precision, Recall and F-Measure regarding the experiment in focus and the differences with the compared one.
-
Select a class and then the magnifying glass icon
 to display the filtered documents that contain it in the Documents statistics tab.
In the Extractions panel you can:
-
Check the extractions of a class, selected in the Resources panel, regarding the experiment in focus and the differences with the compared one.
-
Select an extraction value and then the magnifying glass icon
 to display the filtered documents that contain it in the Documents statistics tab.
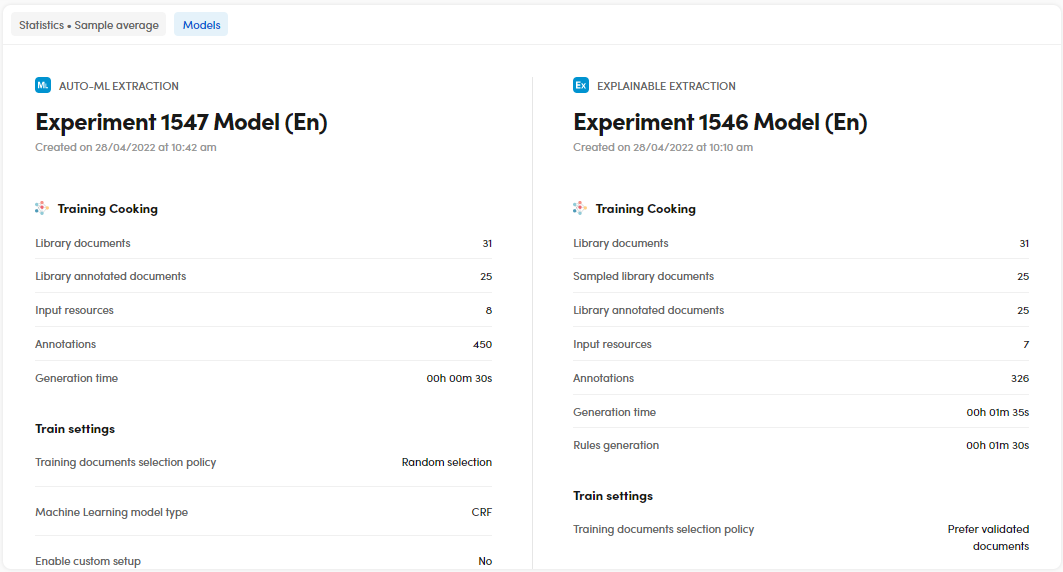
Models
The Models tab compares the two models of the experiments and displays a list of data:
- The experiments models
- Creation date and time
- The experiments names
- Information about the libraries used
- The train settings of the experiments
Compare three or four experiments
The panel, in the upper part, displays the:
- Number of experiments being compared.
- Last experiment name
- Performance date and time
- Experiment author
- Information about documents, library and match strategy.
Also, the Precision, Recall and F-measure charts are displayed in this part.
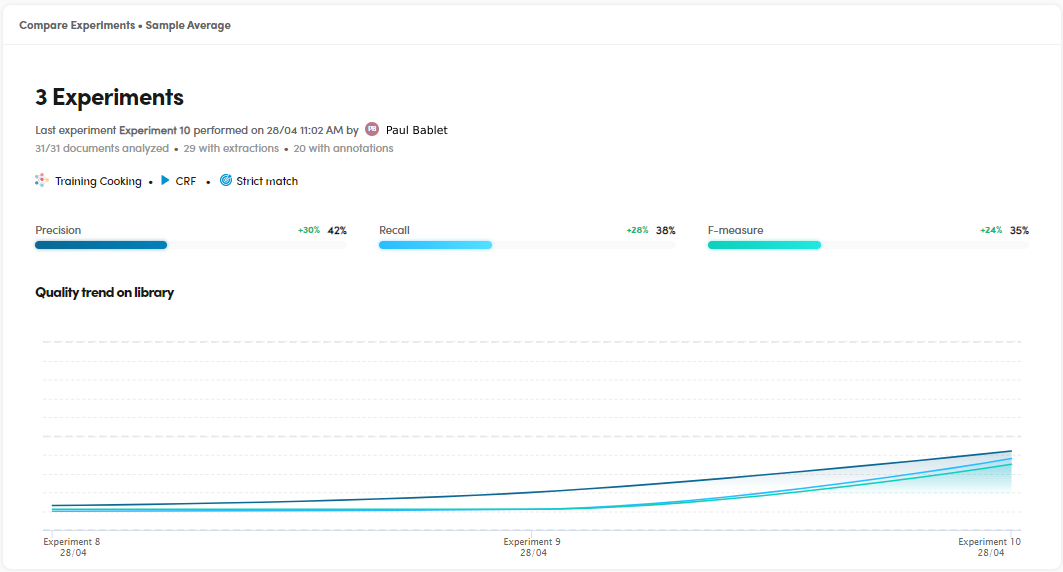
Check the quality trend on library
To check the quality trend on library, read the chart under Quality trend on library.
Hover over the chart to watch more details about the metrics of each experiment.
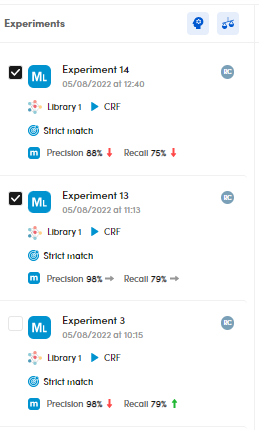
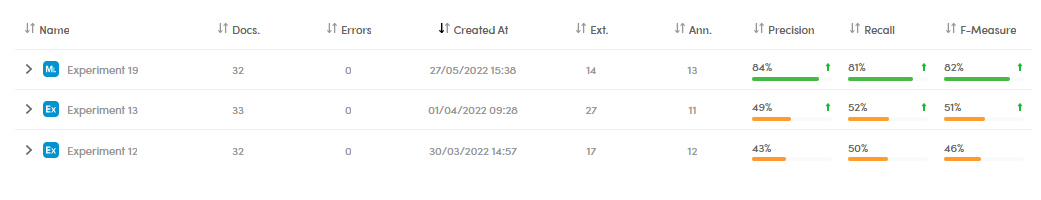
Experiment list
The experiment list displays a summary of the experiments features and their main quality indicators. Ext. represents the number of extractions, while Ann. represents the number of annotations.
Note
Select the expanding arrow  for information about the experiment training library and train settings.
Sort the experiment list
To sort the experiment list, ascending or descending, based on an item, select the arrows beside a column header.
Compare the library coverage
To compare the library coverage, see the charts in the Library coverage area.
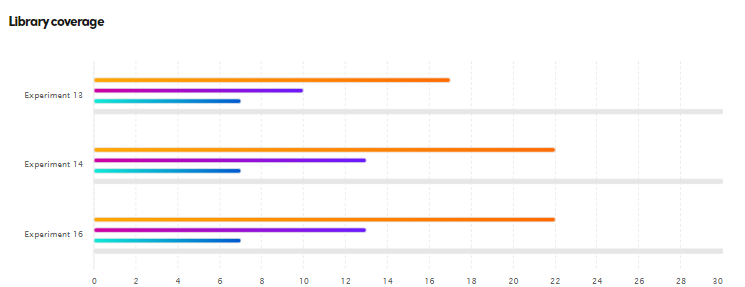
Hover over the:
- Orange line for the number of documents with extractions.
- Violet line for the number of documents with annotations.
- Turquoise line for the number of validated documents.
- Gray line for the total number of documents.
Compare more than four experiments
In case of more than four experiments selected, the display has the same form of the Dashboard panel.