Perform workflow tests
Overview
To use a workflow, it must have been published.
You can test a published workflow interactively in the Test tab of the workflow's workspace. To do that it is not necessary that the workflow is associated with an API key.
Learn about API keys in the article dedicated to the management of NL Flow runtime.
You can also use a published workflow programmatically through the NL Flow API and test it using utilities like Postman. In this case you can download a ready to use Postman collection.
In order to use a workflow programmatically, it is necessary that at least an API key is associated with the workflow and you include one of those keys in every API call.
The way you test a workflow varies depending on whether the workflow was published in synchronous or asynchronous mode.
Synchronous mode
In case of synchronous mode, the Test tab allows you to carry out one test at a time and each test replaces the previous one.
The default view is the one in which you set the input.
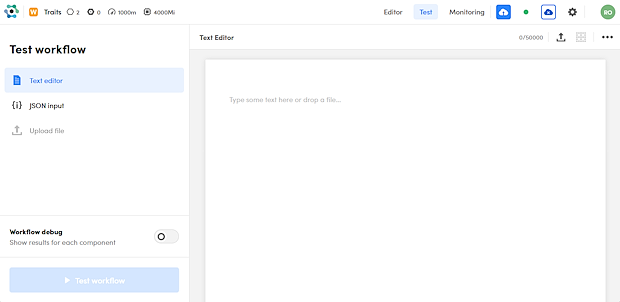
To take a test:
- Set the input.
- (Optional) Turn on Workflow debug to have an output richer in information about the inner functioning of the workflow.
- Select Test Workflow.
Wait for the analysis to be completed and consult the results, more on this below.
To repeat a test—for example after you published changes to the workflow—without having to go back to input and submit it again, select Refresh results  on the toolbar of the left panel.
Asynchronous mode
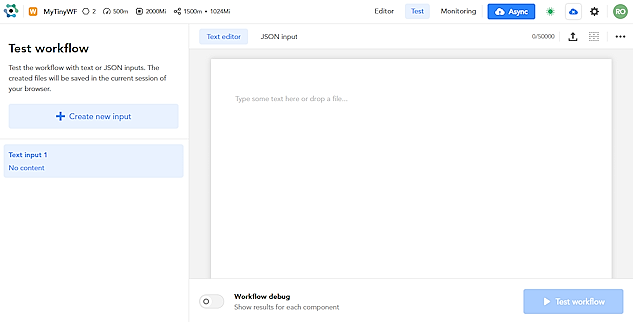
In the case of asynchronous mode it is possible to start new tests while previous tests are still in progress.
The default view is the one in which you set the input for a new test.
Run a test
To take a test:
- Set the input.
- (Optional) Turn on Workflow debug to have an output richer in information about the inner functioning of the workflow.
- Select Test Workflow.
There is no need to wait for the end of the test because the asynchronous execution continues in the background even if you do something else with the NL Flow application or even close the browser.
You can always return to the Test tab of the workflow workspace at a later time to operate on the task as explained below.
Get test info
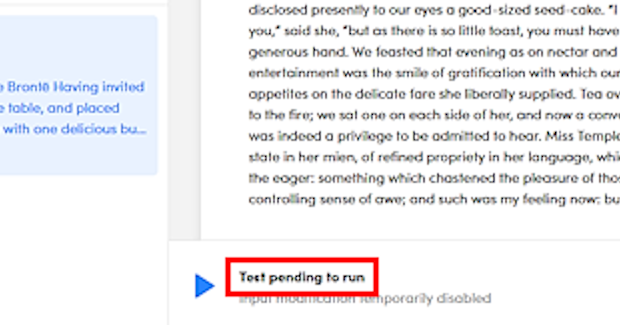
The status of the current test is shown at the bottom of the input panel.
The status of each test is also shown in the corresponding box of the list on the left.
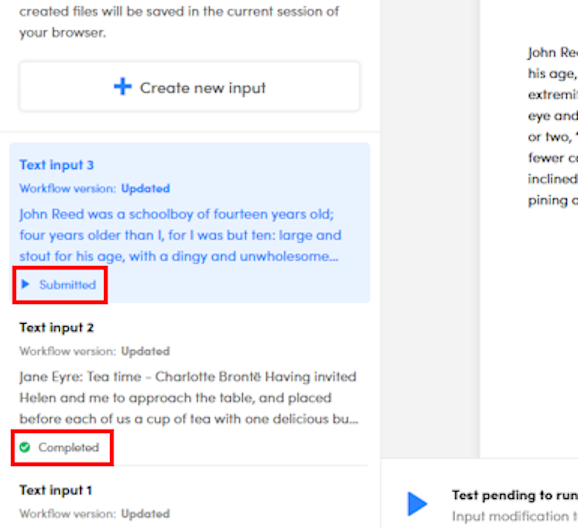
If a test was carried out with the latest published version of the workflow, in the corresponding box in the list on the left Workflow version value is Updated, otherwise it is the date and time of the previous publication. This allows you to compare the results of different versions of the workflow against the same input.
Consult the results of a test
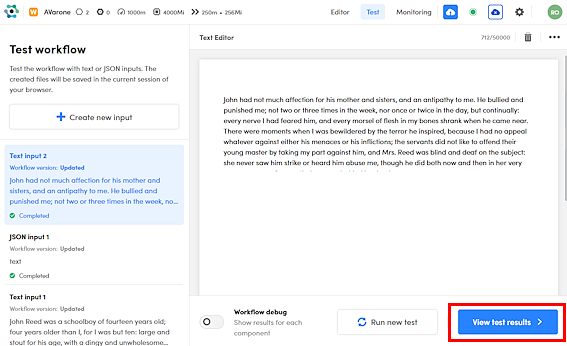
To see the results of a completed test select View test results at the bottom right.
More below on how to examine the results of a test.
Change tests
To switch tests, select another test from the list on the left.
Remove tests
To remove a pending task from the queue:
- Select Remove from test queue
 on the toolbar above the input panel.
Or, if it is the current test and its execution is still pending:
- Select Remove from test queue at the bottom right of the central panel.
To remove all completed tests, select Clear list at the bottom of the left panel.
Repeat a test
To repeat the current test, if completed, select Run again at the bottom of the input panel.
Create a new test
If you have already made tests, whatever their status, you can create a new one. To create a new test select Create new input and proceed as above.
Set the input
The input to a workflow is a JSON that must be compatible with the input of the first block of each independent flow or have the format defined in the editor.
The test GUI is smart and automatically recognizes some aspects of the workflow's input.
If the workflow "wants" a Base64 encoded file and its path, as is the case of a workflow starting with TikaTesseract Converter or Extract Converter, the GUI provides controls for specifying a file as input—saving the user the trouble of performing Base64 encoding—and using the file name as path.
Similarly, if the initial block of the workflow is a model, the GUI allows the user to provide plain text which then will be used to create a basic input JSON containing only the text key filled with user provided text.
The GUI always provides the possibility of directly inserting the input JSON.
Upload a file
If it's possible to a provide a file as workflow's input:
-
If the workflow has been published in synchronous mode:
- If the central panel doesn't display Upload file, select Upload file on the left panel.
-
If the workflow has been published in asynchronous mode:
- If the central panel doesn't display Upload file, select Upload on the left panel.
-
Select Browse files in the Upload file panel to select and open the file.
The central panel will show an icon with the name and the size of the file.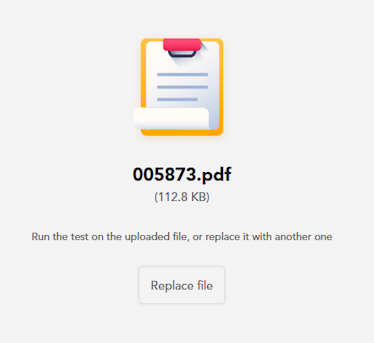
-
To choose a different file, select Replace file.
Enter or load plain text
If it's possible to specify plain text as workflow's input:
-
If the workflow has been published in synchronous mode:
- Select Text editor on the left panel.
-
If the workflow has been published in asynchronous mode:
- If you want to create a new input, select Create new input or Create on the left panel.
- Select the Text editor tab in the central panel.
-
Enter the text in the Text editor panel.
Or:
-
Select Upload file
 on the panel toolbar to upload a text file.
 -
To clear the editor, select Clear text
 on the panel toolbar.
Write or load the JSON
It is always possible to enter the workflow input as JSON.
-
If the workflow has been published in synchronous mode:
- If the central panel is not JSON input, select JSON input on the left panel.
-
If the workflow has been published in asynchronous mode:
- If you want to create a new input, select Create new input or Create on the left panel.
- If it's not the only choice available, select the JSON input tab in the central panel.
-
Enter the JSON in the editor.
Or:
-
Select Upload file
on the panel toolbar to upload a JSON file.Or:
-
Choose a JSON template from the Select JSON input template drop down list on the panel toolbar. Initially, the drop-down doesn't have a title and it's icon is an empty hexagon
 . When selecting it, you see all the hexagons at the beginning of a flow or the symbol representing the workflow's input format.
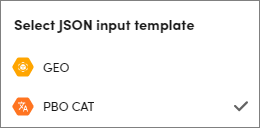
-
Toggle top level keys in the JSON using the checkboxes inside the Filter JSON input keys
 drop down list on the editor toolbar.
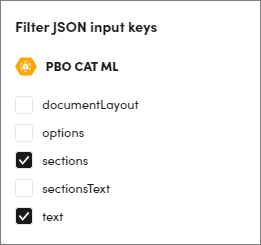
This is necessary when you choose the template of a model, because some top level keys are mutually exclusive, like
documentLayoutandtext.
-
-
To clear the editor, select Clear text
on the panel toolbar.
Examine the results
In case of success, a colored dot followed by HTTP status code is displayed at the bottom of the left panel, for example:
Or:
Debug off
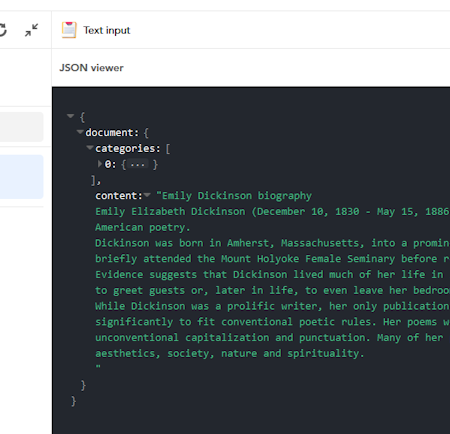
If debug is turned off, the JSON viewer panel shows the output. Above the panel, an icon represents the type of input.
In case of error, the central panel shows the error message in a sub-panel titled Error viewer.
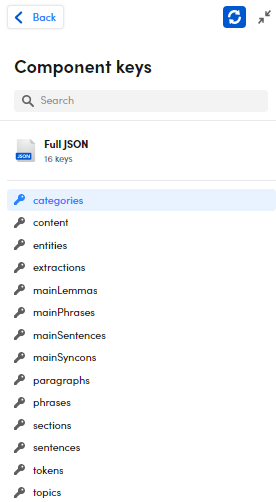
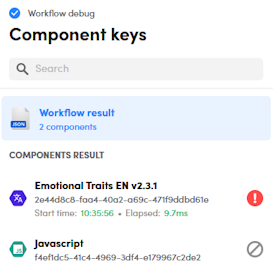
The left panel lists the top level keys of the output JSON.
In case of a workflow with multiple flows, the keys are grouped according to the last block of each flow, for which the name and ID are displayed.
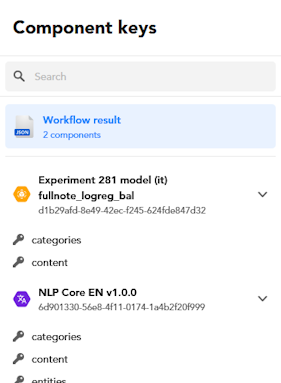
Selecting a key from this list, the central panel shows only the portion of the overall output JSON corresponding to the selected key, in some cases providing also an advanced view that makes it easier to browse data and provides information on the relationship between output data and the input text.
To filter the list, enter a search criteria in the search box then press Enter. To clear the filter select the X icon  inside the search box.
To restore the visualization of the full output JSON:
- Select Full JSON for single-flow workflows.
Or:
- Select Workflow result in case of multiple flows.
Debug on
If debug is turned on, start time, elapsed time and response size are displayed in the second toolbar from the top inside the central panel.
Verbose output is shown in the Full JSON tab of the central panel.
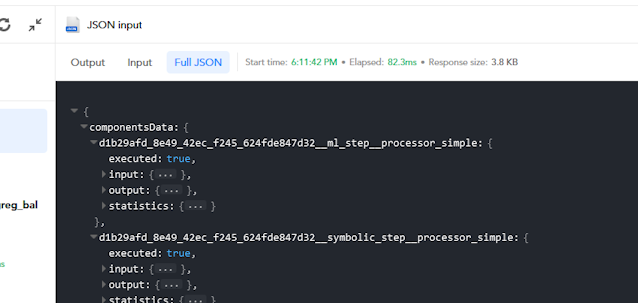
Response size refers to the verbose output, non verbose output may be much smaller.
Warning
Verbose output can be relatively large. If it exceeds 5MB, you get a warning instead of the output.
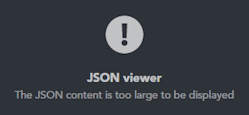
Use alternative tools like Postman to perform tests that generate large output.
In the first toolbar of the panel from the top, an icon represents the type of input.
- To see the JSON input to the workflow, select the Input tab.
- To see the non verbose output of the workflow, select the Output tab.
The left panel lists the blocks of the workflow, divided by flow.
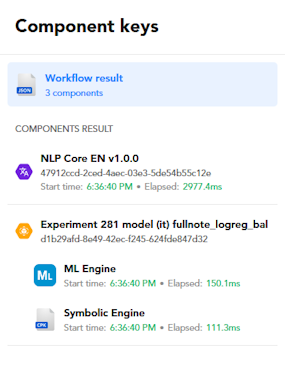
For hybrid ML models, ML Engine and Symbolic Engine sub-components are listed too.
For each block or sub-component, execution start time and execution elapsed time are displayed.
- To see the input and the output of a block, select the corresponding component on the left panel. The output JSON is displayed in the Output tab on the central panel, the input JSON is displayed in the Input tab on the right panel.
In the event of an error with a multi-block workflow, the blocks that gave an error are marked with an exclamation mark and those not executed due to the error with the no-access signal.
Recursive navigation
Contexts
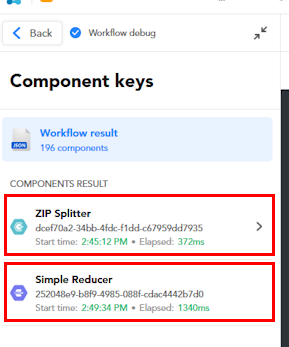
If the workflow contains the contexts of splitters or remappers, you can navigate the results recursively.
Initially, a context is represented by a box in the left panel corresponding to the block that generated it.
For example, if the workflow contains the context of a splitter, followed by a reducer, initially one box for the splitter and one for the reducer are shown in the left panel. Nothing is initially displayed for blocks contained in the splitter's context.
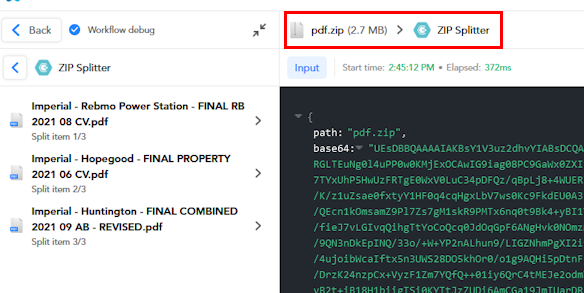
Selecting the box of a context-generating block:
- The Input tab appears in the central panel, showing the input JSON of the block.
- In the first toolbar from the top of the central panel, the navigation path of the results of the workflow completed so far is shown, "breadcrumbs" style, with the input type or file as the first portion of the path.
- In the second toolbar from the top of the central panel, the start and elapsed times of the block—not of the entire context—are shown.
- The left panel lists the items on which the context blocks have iterated. Above the list is the name of the context-generating block.
If you select an item:
- A JSON representing the item is displayed in the center panel.
- At the top of the left panel and at the end of the breadcrumbs the name of the item is displayed, which is a file name if the item was produced from a ZIP splitter or an artificial name otherwise.
- In the left panel the list of items is replaced by that of the blocks of the context executed for the single item.
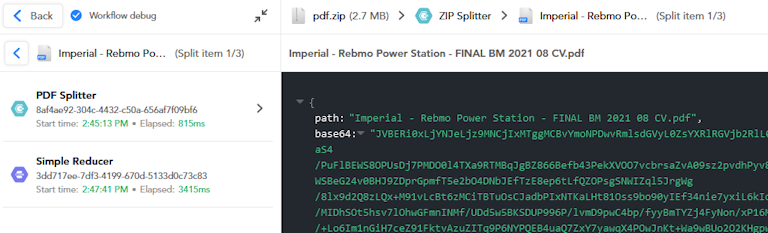
If during navigation you encounter a nested context-generating block, such as a splitter or a remapper, the above pattern repeats, allowing you to navigate to the most nested blocks of each iteration.
Conditional branches
Also in the case of a Switch block, when browsing the results, all the conditionally executed branches downstream of the Switch block are represented collapsed in the left panel.
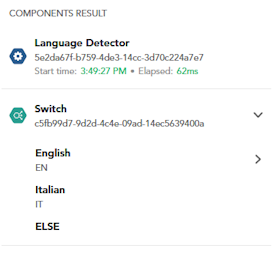
All the conditions are displayed and those that were met are marked with a right arrow.
By selecting the Switch block box, the left panel shows the output at the convergence point of the branches, that is at the End Switch block.
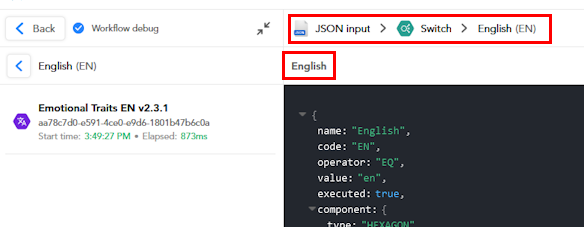
By selecting a satisfied condition, the left panel shows the blocks of the corresponding workflow branch and the central panel shows a synthesized JSON, for diagnostic purposes, which represents the followed branch. This JSON contains:
- Name, code, comparison operator and evaluated value of the condition.
- An
executedboolean flag set to true, indicating that the condition has been met and the branch executed. - Diagnostic data of the blocks of the branch, possibly nested. For each block, under the
componentkey, component type, block ID, software service ID, input, output and statistics are indicated.
The first toolbar from the top of the central panel shows a breadcrumbs path corresponding to the condition, while the second toolbar shows the name of the condition.
Detailed statistics on the execution of a block may appear in the right panel.
To toggle the display of this information select Toggle statistics  on the second toolbar from the top in the central panel.
To navigate backwards:
- Select the left arrow preceding the block name in the left panel to make a step back.
Or:
- Select anywhere in the breadcrumbs to jump back to the corresponding step.
Common commands
To collapse and expand the left panel showing results, use the collapse button  and the expand button
  on the panel toolbar.
To return to input view, select Back—or the left blue arrow, if the panel is collapsed—on the toolbar of the left panel.
For panels showing output JSON:
- To expand or collapse all the sections of the JSON at once, select Expand all
 or Collapse all
  on the panel toolbar.
 - To copy the JSON to the clipboard, select Copy result to clipboard
 on the panel toolbar.
 - To save the JSON to a file, select Download result
 on the panel toolbar.
 - To expand or collapse a JSON object, select the expand button
 or the collapse button
  to the left of the object inside the JSON.
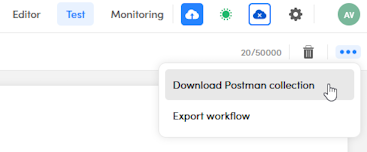
Download the Postman collection
To download a Postman collection with which you can test a published workflow through the NL Flow API, go in the initial page of the test interface and choose Download Postman collection on the ellipsis  menu to the right of the input editor toolbar.
Once you have imported the collection into Postman, set collection variable API_KEY with the value of one of the API key linked with the published workflow. You can find more information about workflow-key association in the description of the Runtime view of the main dashboard of the NL Flow app.
Export the workflow
To export the workflow, , go in the initial page of the test interface and choose Export workflow on the ellipsis menu to the right of the input editor toolbar
The procedure creates and downloads to your computer a file with the .wfpk extension which contains the workflow definition and all non-standard components. For example, if the workflow contains blocks corresponding to symbolic or ML models, these will be included in the file, while processors, operators and knowledge models will only be referenced in the definition. This can make a big difference in file size.
The .wfpk files can be used to import the workflow into another NL Flow installation or as a backup.