Run the test and examine the result
Run the test
If you want to get debug information, turn on Workflow debug in the left panel.
To run the test, select Test workflow on the left panel.
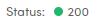
After the test, in case of success, a colored dot followed by HTTP status code is displayed at the bottom of the left panel, for example:
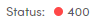
Or:
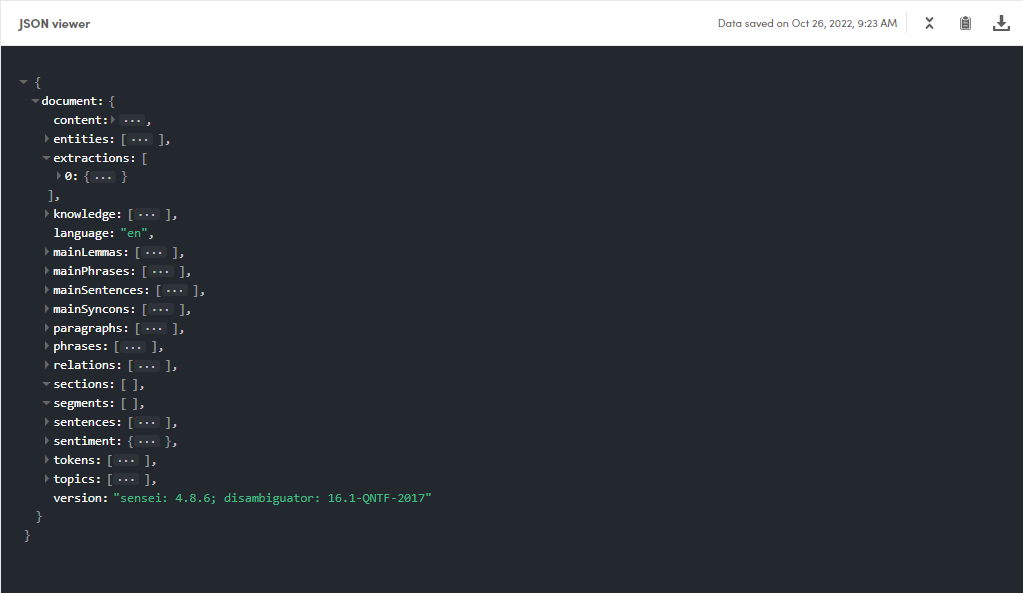
If workflow debug is off, the right panel shows the output of the workflow inside a JSON viewer.
In case of error, if workflow debug is off, the right panel shows the error message in a sub-panel titled Error viewer.
If workflow debug is turned on, the panel on the right shows three tabs—Output, Input and Full JSON—plus start time and elapsed time.

Common commands
To collapse and expand the left panel, use the collapse button  and the expand button
  on the panel toolbar.
To refresh the results—for example after you published changes to the workflow—without having to go back to input and submit it again, select the refresh icon  on the left panel toolbar.
To return to input, select Back on the left panel toolbar.
For panels showing JSON:
- To expand or collapse all the sections of the JSON at once, select Expand all
 or Collapse all
  on the panel toolbar.
 - To copy the JSON to the clipboard, select Copy result to clipboard
 on the panel toolbar.
 - To save the JSON to a file, select Download result
 on the panel toolbar.
 - To expand or collapse a JSON object, select the expand button
 or the collapse button
  to the left of the object inside the JSON.
Examine keys
When debug mode is off, the left panel lists the top level children of the document key of the output JSON.
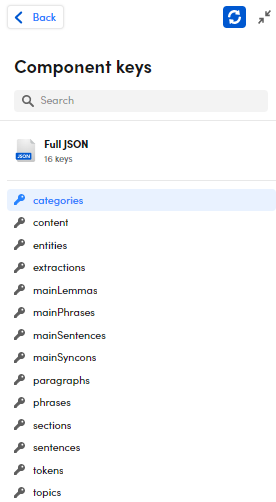
Selecting from this list, the right panel shows only the portion of the overall output JSON corresponding to the selected key, in some cases providing also an advanced view that makes it easier to browse data and provides information on the relationship output data and the input text.
To filter the list, enter a search criteria in the search box then press Enter. To clear the filter select the "X" button  inside the search box.
In case of a workflow with multiple flows, the keys are grouped according to the last block of each flow, for which the name and ID are displayed.
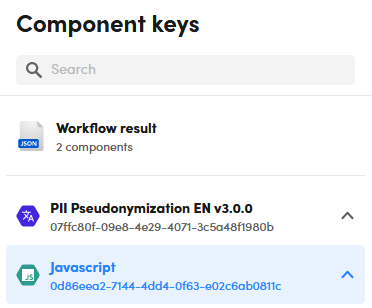
To display the entire output JSON instead of the selected key, select Full JSON for single flow workflow or Workflow result in case of multiple flows.
Debug mode
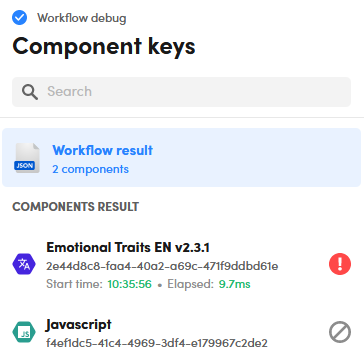
When workflow debug is on, the left panel lists the components corresponding to the workflow blocks under the COMPONENT RESULT label.
-
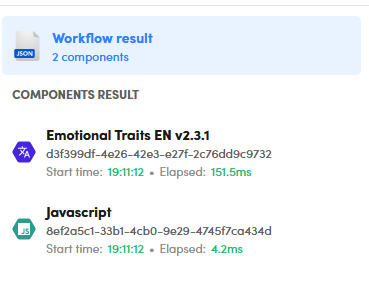
To get information about the whole workflow, select Workflow result on the left panel.
On the right panel you can:
- Find the overall workflow output in the Output tab.
- Find the workflow input in the Input tab.
- Find a verbose version of the workflow output in the Full JSON tab.
-
To see the output of a block, select the corresponding component from the list under COMPONENT RESULT on the left panel. The JSON is displayed in the Output tab on the right panel.
-
To see the input of a block, if any, select the corresponding component from the list under COMPONENT RESULT on the left panel. The JSON is displayed in the Input tab on the right panel.
All panels showing JSON have the same toolbar providing common commands.
In the event of an error with a multi-block workflow, the blocks that gave an error are marked with an exclamation mark and those not executed due to the error with the no-access signal.